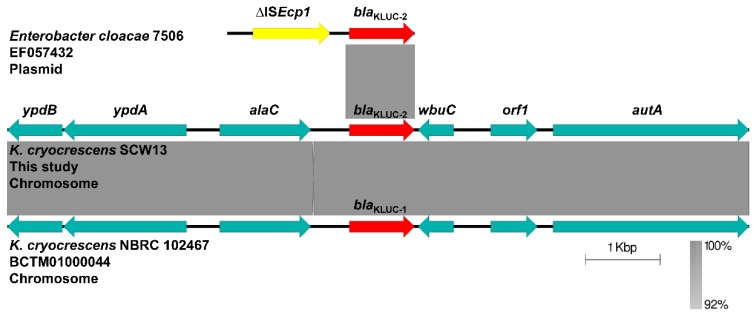
Figure 2.
Comparative analysis of the genetic context of blaKLUC-2 and blaKLUC-1. Genes and insertion sequences are indicated by arrows. Light gray shades denote shared regions with a high degree of homology. The construction of sequence comparison was performed using BLAST [29] and Easyfig version 2.2.3.

