Figure 3.
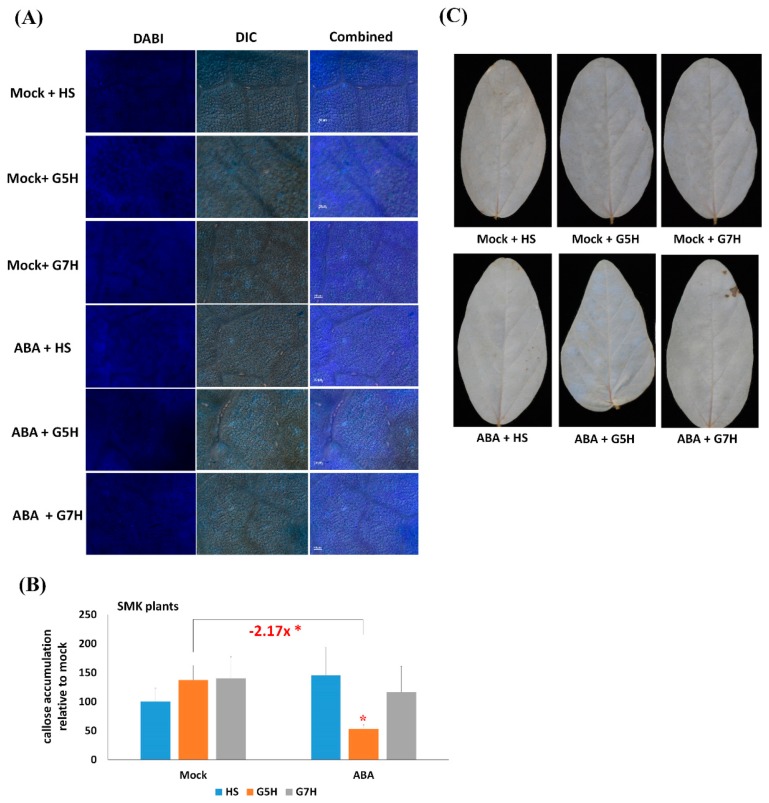
Levels of callose and ROS in SMK plants as affected by ABA treatment and G7H or G5H infection. SMK plants were treated with combinations of Mock (0.1% MeOH) or ABA (100 µM), and sap from healthy plants (HS), sap from G7H-GFP-infected plants (G7H), or sap from G5H-GFP-infected plants. Samples were collected 5 dpi and subjected to (A) aniline blue staining to detect callose accumulation levels, (B) quantification of callose fluorescence, and (C) DAB staining to reveal ROS accumulation. The experiment was carried out in three independent replicates, and values are means ± SD of three biological replicates. Statistical analysis was carried out as described in Figure legend 1, with additional comparison between Mock-G5H and ABA-G5H plants. Asterisks in red color indicate significant decrease at P < 0.05.

