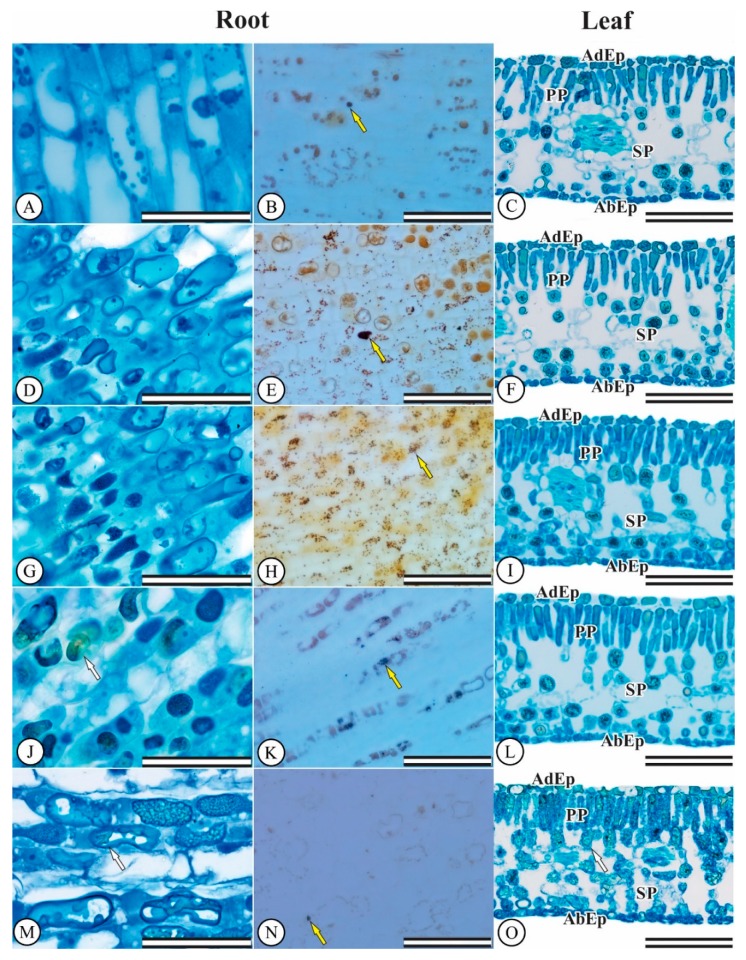
Figure 3.
Eugenia dysenterica root and leaf anatomy after 20 days of growth at various Al concentrations. (A–C) control treatment, (D–F) 200 μmol L−1 Al3+, (G–I) 400 μmol L−1 Al3+, (J–L) 600 μmol L−1 Al3+, (M,N,O) 800 μmol L−1 Al3+. (AdEp) adaxial epidermis. (AbEp) abaxial epidermis. (PP) palisade parenchyma. (SP) spongy parenchyma. (A,B,D,E,G,H,J,K,M,N) root meristem and differentiation zone. (C,F,I,L,O) leaf mesophyll cells. White arrows indicate the production of phenolic compounds and yellow arrows indicate starch accumulation. (First column) Scale bar = 50 μm. (Second and third columns) Scale bar = 100 μm.

