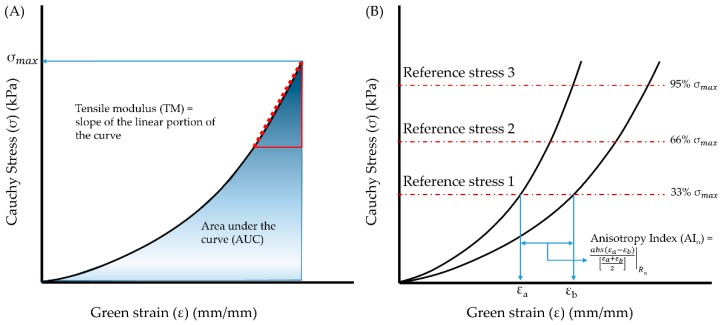
Figure 2.
Biomechanical parameters evaluated from the stress–strain curves generated from biaxial mechanical testing of porcine abdominal aorta specimens. (A) Schematic for calculation of area under the curve (AUC) and maximum tensile stress (). (B) Procedure for calculation of anisotropy index () at each reference stress level, as reported in [39,40]. The reference stresses for each specimen were calculated by estimating 33rd, 66th, and 95th percentiles of in each stress–strain curve.

