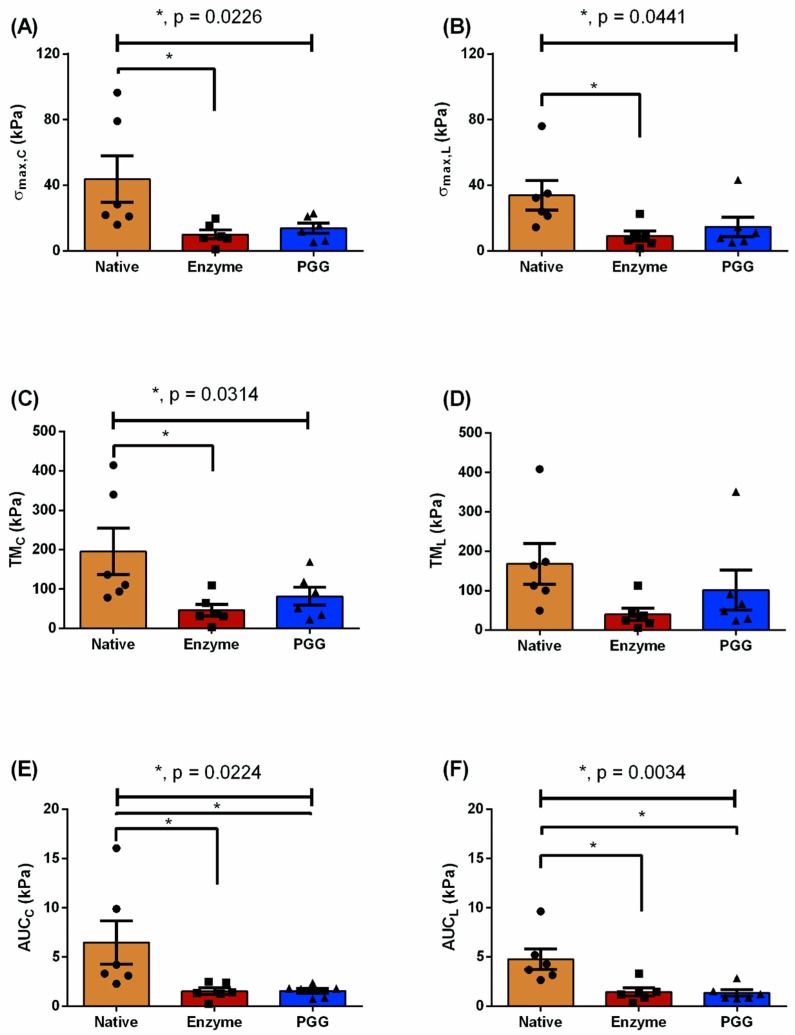
Figure 4.
Biomechanical parameters for the native (N), elastase-digested (E), and PGG-treated (P) porcine abdominal aorta specimens, which are represented as mean ± SEM. Maximum stress (kPa) is displayed in both circumferential () (A) and longitudinal orientations () (B). (C,D) tensile moduli (TM) (kPa) and (E,F) area under the curve (AUC) (kPa) for both circumferential and longitudinal directions, respectively. *denotes significance across the groups (p < 0.05).

