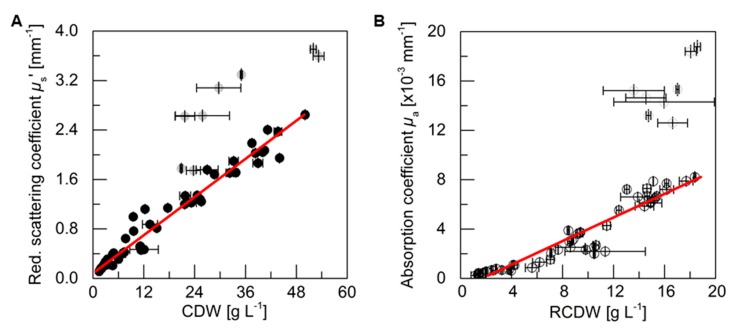
Figure 4.
Correlation analysis of PDW spectroscopy signals with off-line values. (A) Reduced scattering coefficient µs’ at 638 nm is correlated with CDW. (B) Absorption coefficient µa at 638 nm is correlated with RCDW. Data points are from five cultivations with different rapeseed oil and urea contents (cf. Figure 2 and Figure 3). The gray data points comprise the last four samples of the two pulse-based fed-batch experiments (cf. Figure 3), which differ significantly from the other samples and were therefore not considered for the linear fit with the experimental data. A squared correlation coefficient R2 of 0.96 was obtained for µs’ and CDW and R2 of 0.90 for µa and RCDW. Error bars indicate minimum and maximum values of technical duplicates (CDW, RCDW). STDEV of the 10-point average is shown for µs’ and µa.

