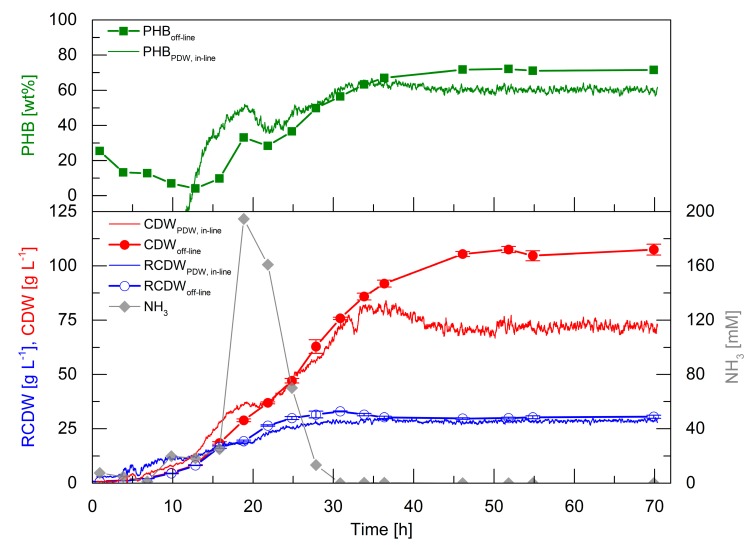
Figure 5.
Fed-batch cultivation of R. eutropha H16 for PHB production. The culture was started with 4% (w·v−1) rapeseed oil and 4.5 g·L−1 urea (150 mM nitrogen). Rapeseed oil feeding linearly increased from 7 h with an initial feeding rate of 3.5 g·h−1 to 35 h with a final feeding rate of 23 g·h−1 up to a total concentration of 17% (w·v−1). Urea (30% (w·v−1)) feeding was linearly increased from 7 h with an initial feeding rate of 0.39 mL·h−1 up to a final feeding rate of 6.58 mL·h−1 at 16 h to a total concentration of 14.4 g·L−1. In-line PHB content (upper graph, green line, wt%) by PDW spectroscopy and off-line PHB content (upper graph, green squares, wt%), estimated in-line CDW by PDW spectroscopy (bottom graph, red line, g·L−1), off-line CDW (bottom graph, red filled circles, g·L−1), estimated in-line RCDW by PDW spectroscopy (bottom graph, blue line, g·L−1), off-line RCDW (bottom graph, blue empty circles, g·L−1), and ammonia content (bottom graph, grey diamonds, mM) are shown. Error bars indicate minimum and maximum values of technical duplicates.

