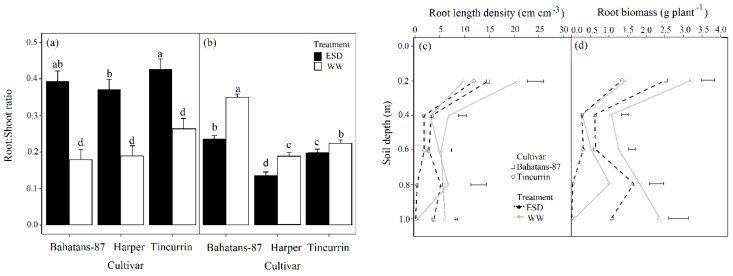
Figure 6.
Root: Shoot ratio at (a) the end of the drought treatment (30 DAS) and (b) anthesis; (c) the distribution of root length density, and (d) root biomass down the soil profile in wheat cultivars with different root systems, grown under well-watered conditions (WW) and exposed to early season drought (ESD). ESD was induced by simulating a 25 mm rainfall after sowing in dry soil and no watering for 30 days. Means followed by different letters across cultivars and treatments in (a) and (b) are significantly different at p < 0.05. Vertical error bars in (a) and (b) represent s.e. of the mean (n = 5). Horizontal bars in (c) and (d) represent LSD at p < 0.05 for comparison between cultivars at each depth in the soil profile.

