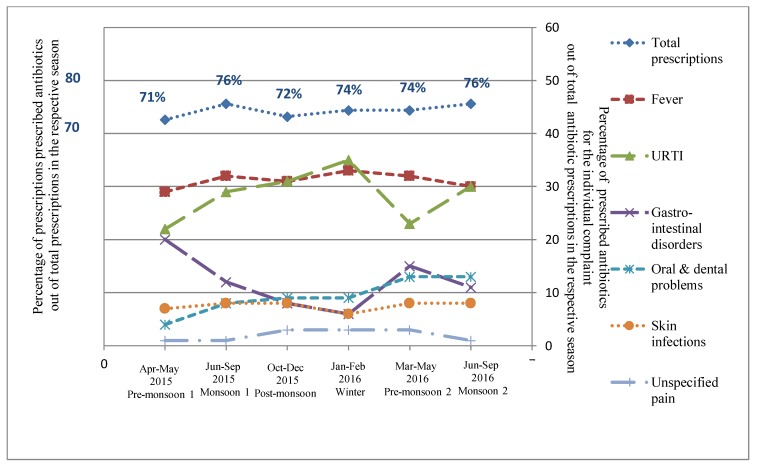
Figure 1.
Relative distribution of proportion of prescribed antibiotics out of the total prescriptions in the respective seasons and percentage ofprescribed antibiotics for the individual complaint out of the total antibiotic prescriptions in the respective seasons in rural Ujjain, India. X axis represents the seasons (April–May 2015 Pre-monsoon 1, June–September 2015 Monsoon 1, October–December 2015 Post-monsoon, January–February 2016 Winter, March–May 2016 Pre-monsoon 2, June–September 2016 Monsoon 2); Primary Y axis on left represents the percentage of prescribed antibiotics out of total prescriptions in the respective season and secondary Y axis on right represents the percentage of prescribed antibiotics for the individual complaints (Fever, URTI—Upper respiratory tract infection, Gastro-intestinal disorders, Oral and dental problems, Skin infections, and Unspecified pain) out of the total antibiotic prescriptions in the respective seasons.

