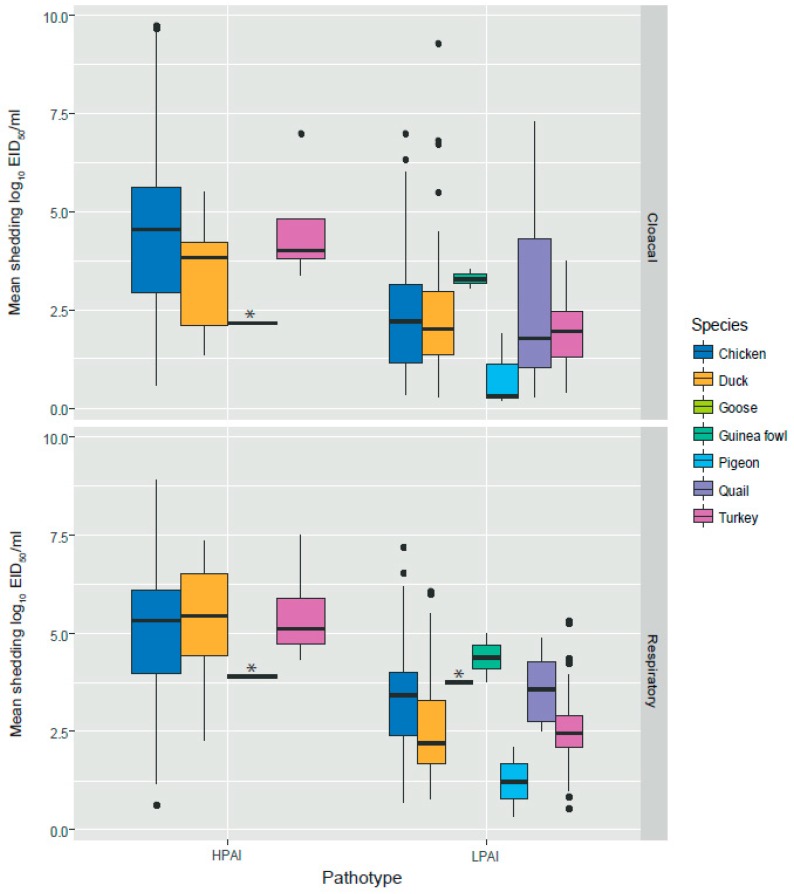
Figure 3.
Distribution of mean shedding levels (log10 EID50/mL) in respiratory and cloacal swabs of highly pathogenic avian influenza (HPAI) virus and low pathogenic avian influenza (LPAI) virus distributed by species. The box represents the first quartile, the median (band inside the box) and the third quartile. Individual black dots are outliers. * indicates goose data (box is not visible because there was only one observation).

