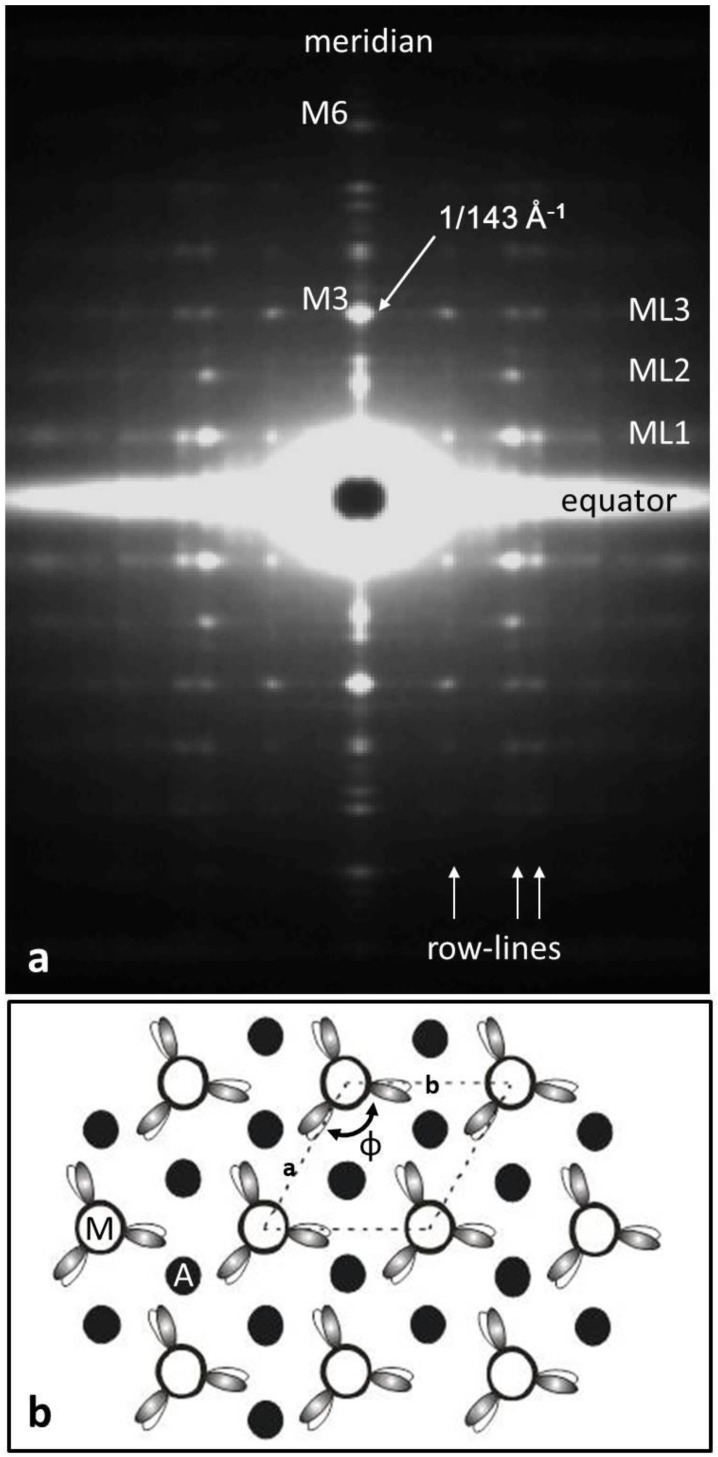
Figure 2.
(a) The low-angle X-ray diffraction pattern from bony fish muscle (fibre axis vertical) showing the horizontal layer-lines and vertical row-lines on which the observed peaks are situated. Almost all of what can be seen here comes from the myosin filaments in the muscle. (b) The “simple lattice” unit cell of the A-band lattice in bony fish muscle viewed down the fibre axis showing the single rotation (N) of the myosin filaments around their long axes and the 3-fold rotational symmetry of the head arrangement on one crown of heads. Actin filament positions (black circles) at the trigonal points are labelled A.

