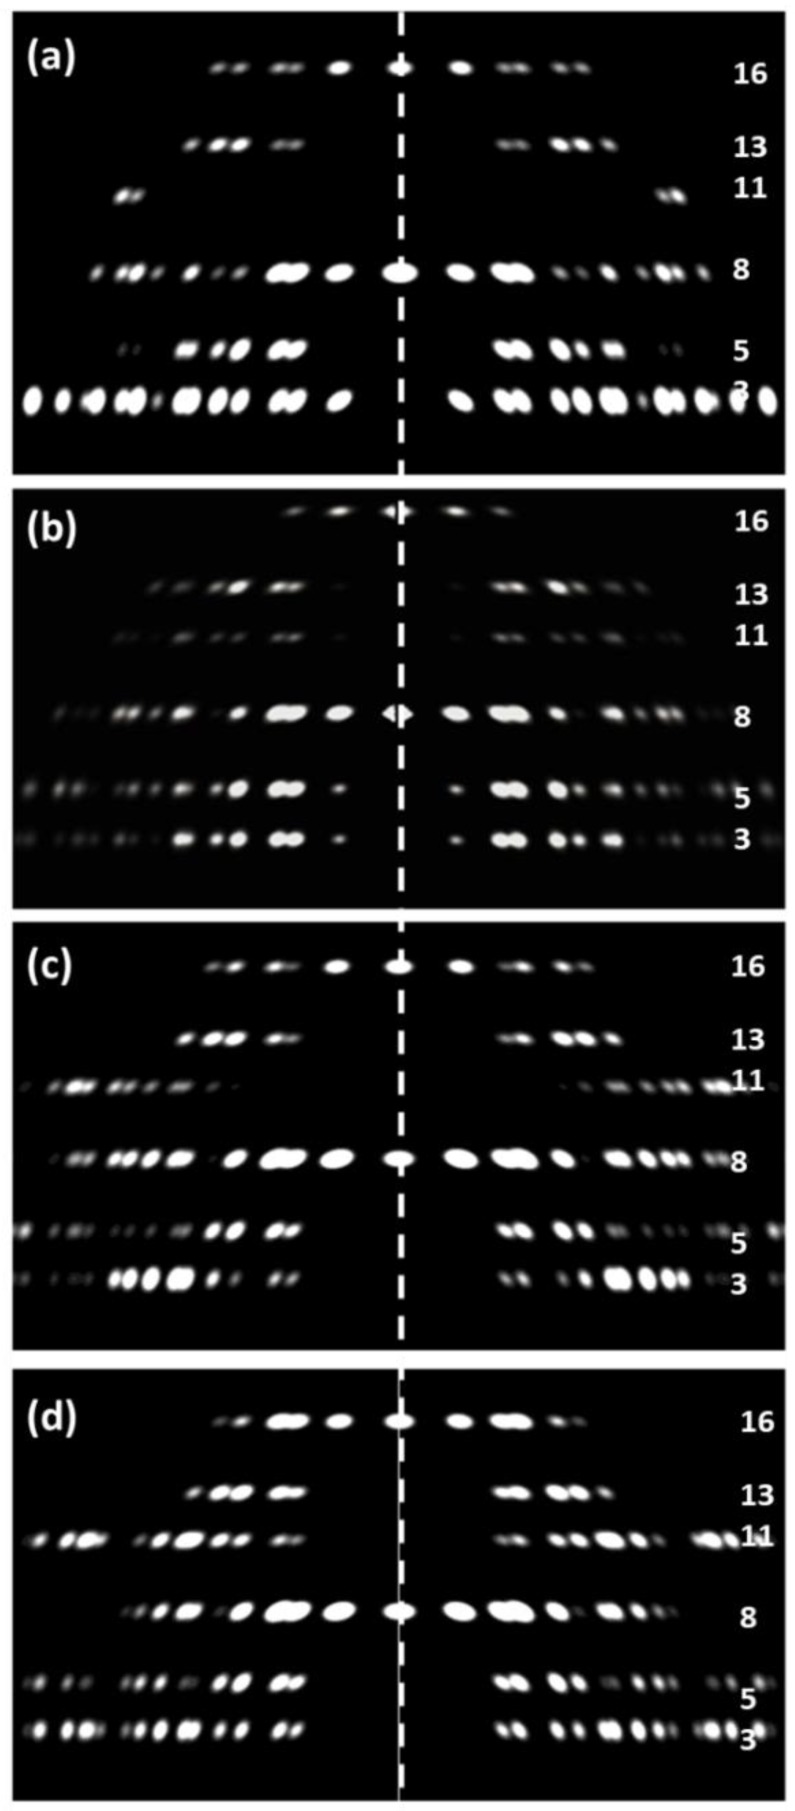
Figure 11.
Comparison of the observed low-angle X-ray diffraction pattern (a) from relaxed insect (Lethocerus) flight muscle after processing (upper half of Figure 6a) and the simulated diffraction patterns from various versions of the insect myosin filament in the unit cell: (b) The published model from AL-Khayat et al. [11], R-factor = 9.7%; (c) The density map from Hu et al. [27] (Figure 7) put into the insect unit cell; R-factor = 33%, (d) The fitted atomic model with the interacting heads motif (Figure 8 and Figure 9), R-factor = 27%. (b–d) used the R-factor given in Equation (3). Layer-line numbering is based on the approximate 1160-Å axial repeat in insect flight muscle. Layer-line 3 was not used for the R-factor calculations, because both actin and troponin contribute to that layer-line as well. All patterns were scaled to give the same total intensity in the pattern, apart from (b) which is modified from the results of AL-Khayat et al. [11] and scaled to look similar to the other patterns. Introduction of a lateral (2D) disorder factor slightly improved the R-factors in (c) and (d) to 21% and 19% with a root mean squared displacement of the myosin filament from its ideal lattice point of 18 Å and 17 Å respectively.

