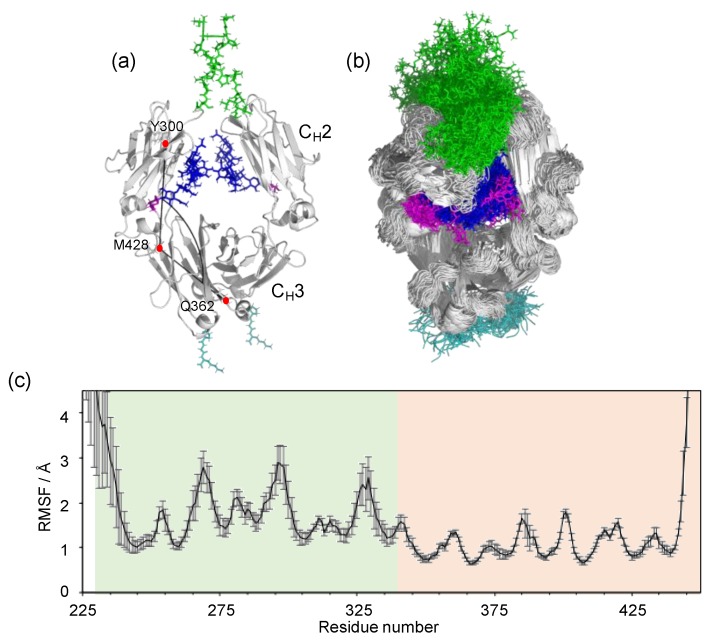
Figure 1.
MD simulation of IgG1-Fc. (a) The starting structure of the MD simulation, based on the crystal structure of fucosyl IgG1-Fc (3AVE) supplemented with the hinge (green; T224–E233 in chain A and T224–G236 in chain B) and C-terminal (cyan; P445–K447) segments along with the terminal galactose residues (magenta) of the α1-6Man branches. The N-glycans are colored blue except for the terminal galactose. The intra-chain domain-orientation angle between CH2 and CH3 defined by Cα atoms of Y300, M428, and Q362 are shown in chain A. (b) The superposition of 256 structures extracted every 100 ns from the MD trajectory. The structures were visualized by PyMOL (https://www.pymol.org). (c) The RMSF for each amino-acid Cα atom of IgG1-Fc, which was calculated as described in Materials and Methods. White, hinge; light green, CH2; light orange, CH3.

