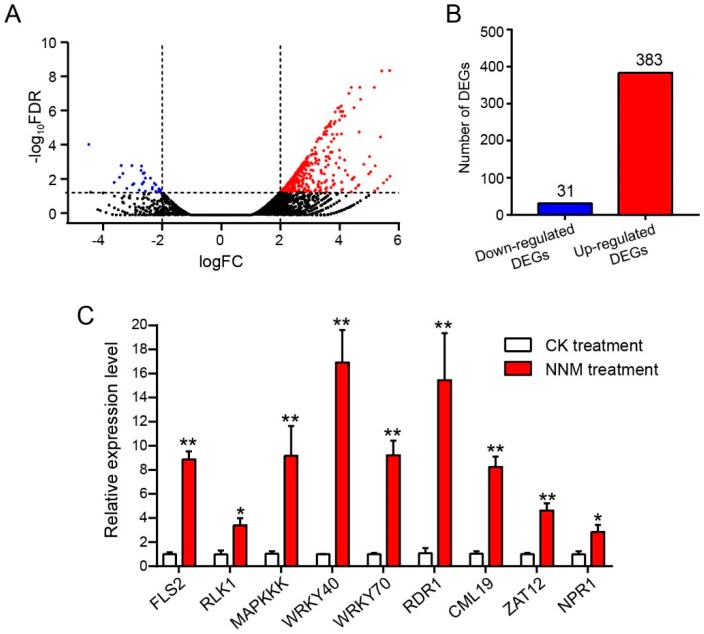
Figure 2.
NNM-induced differential gene expression in BY-2 protoplasts. (A) Numbers of up-regulated genes (in red) and down-regulated differentially expressed genes (in blue) were shown (false discovery rate (FDR) < 0.05 and ≥ 2-fold change). Black dots indicate non-differentially expressed genes (FDR ≥ 0.05). (B) Differentially expressed genes (DEGs)—383 up-regulated, and 31 down-regulated—are listed. (C) RT-qPCR verification on regulation of nine DEGs induced by NNM. An equal volume of sterile water treatment was used as a control. * indicate a significant difference (p < 0.05) and ** indicate a significant difference (p < 0.01).

