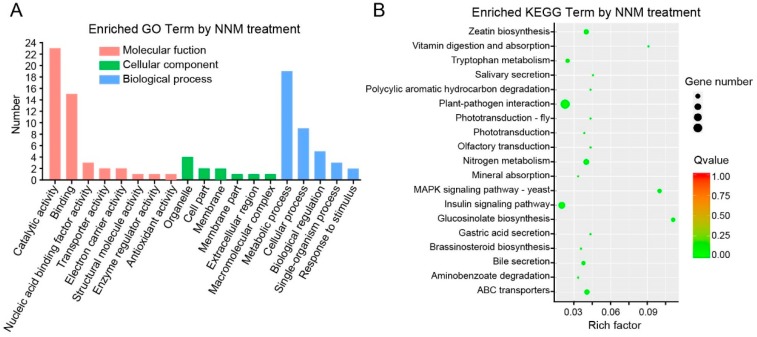
Figure 3.
DEGs enriched in Gene Ontology (GO) and Kyoto Encyclopedia of Genes and Genomes (KEGG) analysis induced by NNM. (A) GO terms of three categories significantly enriched in DEGs of NNM vs. CK involved in molecular function, cellular component, and biological process. (B) KEGG pathways of the significantly enriched DEGs. The rich factor reflects the degree of enriched DEGs in a given pathway. The number of enriched DEGs in the pathway is indicated by the circle area, and the circle color represents the ranges of the corrected p-value.

