Fig. 2.
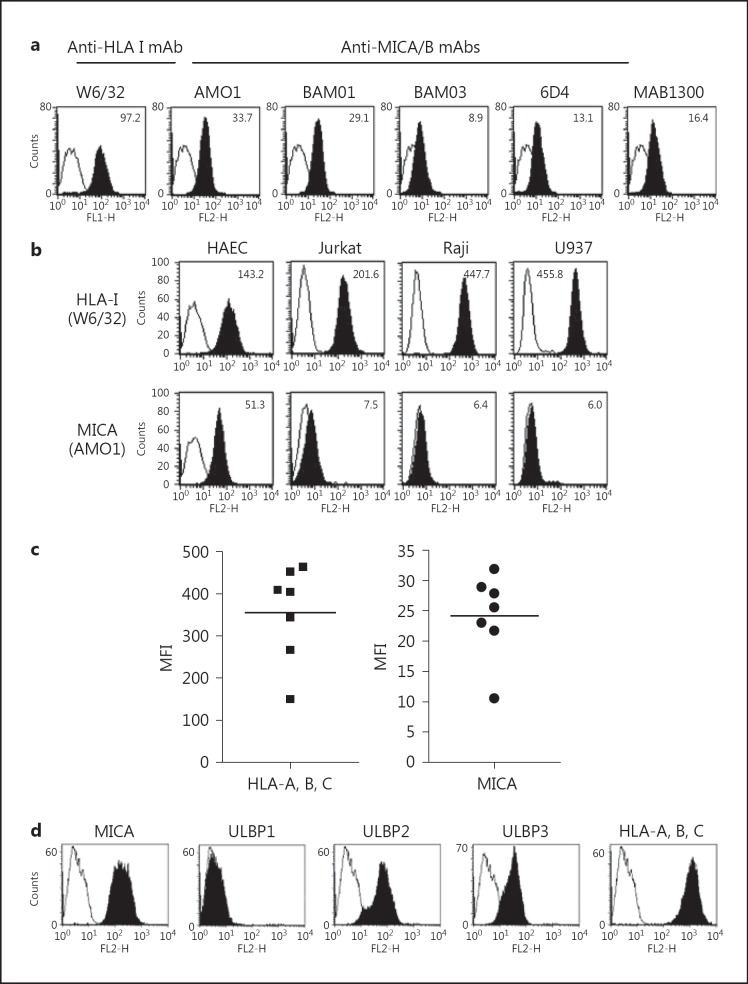
Constitutive expression of functional MICA at the EC surface. a Flow cytometry analysis comparing HLA-A, B, C and MICA expression at the cell surface on resting, unstimulated HAEC using various anti-MICA/B mAbs. The mean of specific fluorescence intensities are indicated. b Comparative analysis of basal MICA expression on ECs and lymphoid T (Jurkat), B (Raji) and monocytoid (U937) cell lines. c Profiles of classical HLA class I and MICA expression on vascular ECs isolated from transplant donors. HAEC isolated from normal volunteers (n = 7) were stained with mAbs for HLA-A, B, C (W6/32) or MICA (AMO1) as described in Materials and Methods. Cell surface expression of HLA-A, B, C and MICA cells was examined by flow cytometry and was expressed as the mean of fluorescence intensity (MFI); the horizontal bar represents the mean of the 7 determinations. d Comparative analysis of NKG2D ligands expressed at the EC surface. A representative analysis showing the expression of MICA, ULBP1, ULBP2, ULBP3 and HLA-A, B, C on ECs assessed by flow cytometry. Means of specific fluorescence intensity are indicated. Data are representative of 3 independent experiments.

