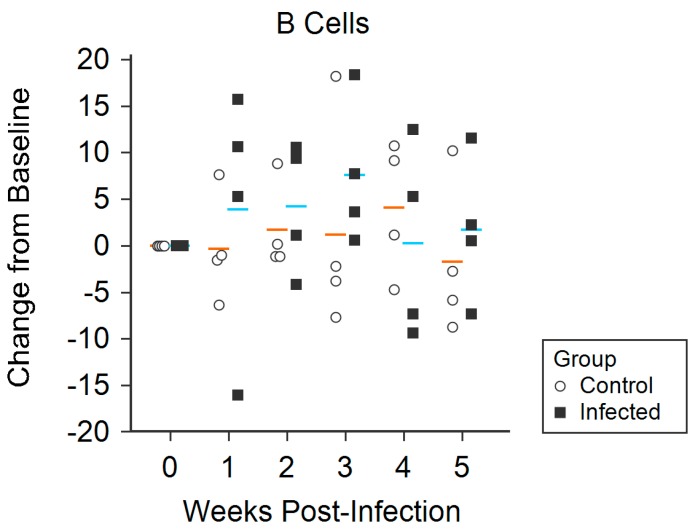
Figure 6.
Trends of measured B cells over the course of the study period, reported as the change in percentage of cells from initial pre-infection measurement (standardized to 0 on the y-axis); horizontal lines indicate the mean change in percentage for each group, where blue represents that of infected animals and orange represents that of control animals.

