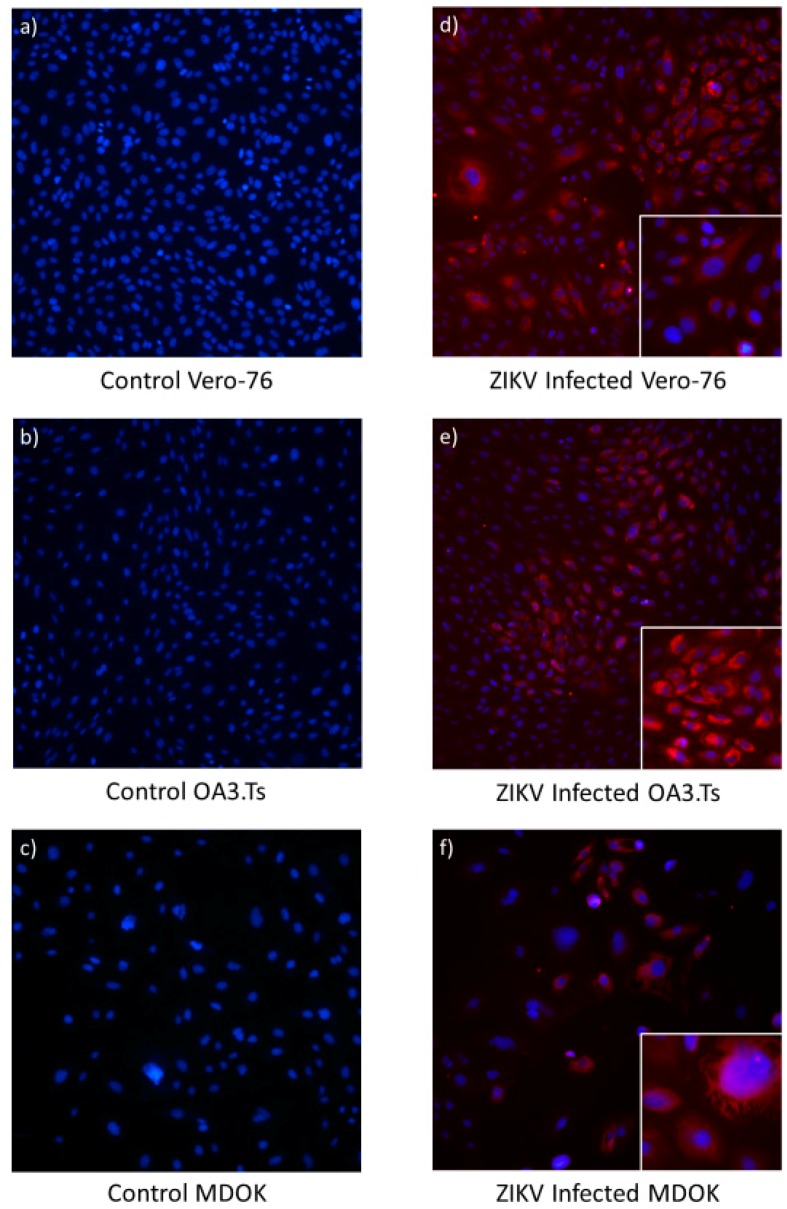
Figure 8.
Photomicrograph comparing uninfected and ZIKV infected Vero-76 (a and d), OA3.Ts (b and e), and MDOK cells (c and f) at 48 h PI. The nuclei of both infected and uninfected cells were stained with DAPI (blue), while immunofluorescence (red) illustrates the perinuclear and cytoplasmic presence of the ZIKV E protein in infected cells (panels d–f). All large panels are shown at 10× magnification, while smaller panels in the lower right-hand corner of panels d–f illustrate individual infected cells at 20× magnification.

