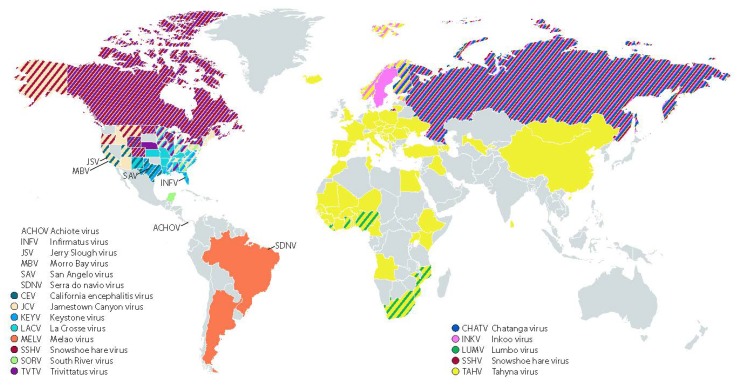
Figure 2.
Map of the geographical distribution of the California serogroup viruses, expanded from Figure 1A in [21]. Geographic distribution is based on positive serology of humans and animals, mosquito isolations of virus, and probable and confirmed human cases.

