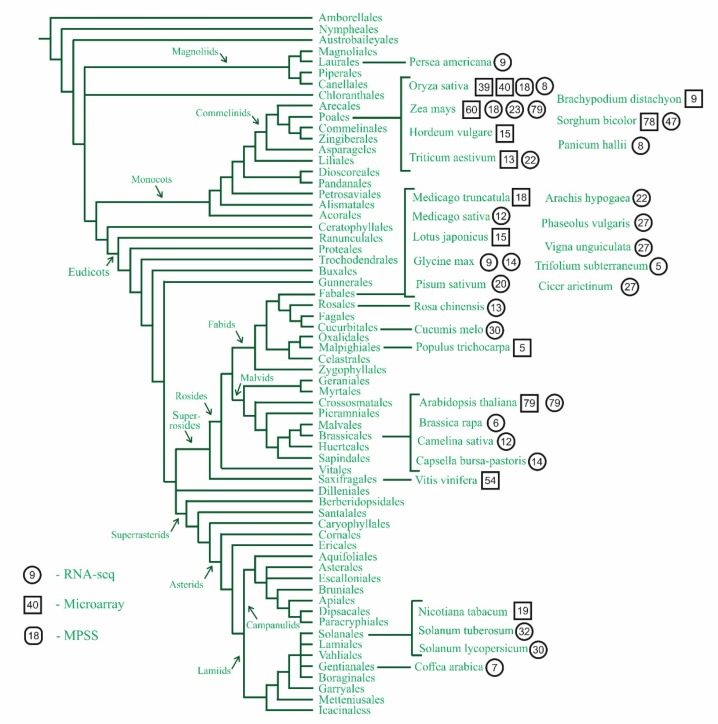
Figure 1.
The representation of taxa among gene expression atlases. The number of samples (organs, tissues, or cells) is indicated by circles for RNA-seq-based transcriptome maps and squares for microarray-based transcriptome maps. The figure is represented the APG IV classification of plants and is adapted with permission from [16].

