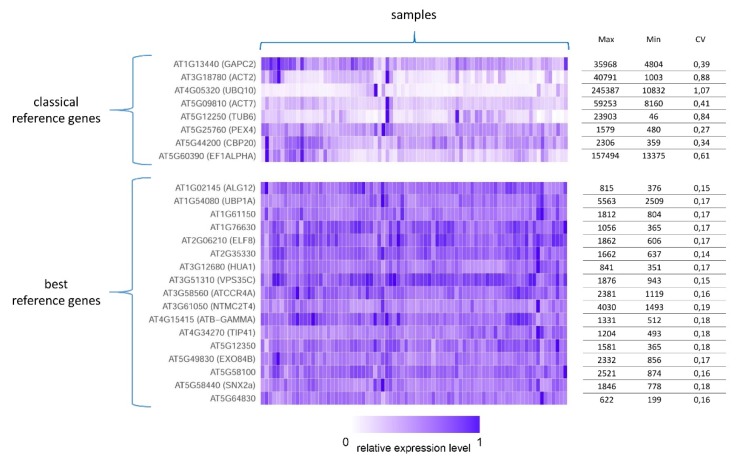
Figure 3.
Heatmap of the expression of the most stable genes and classical reference genes in the A. thaliana transcriptome map. Each column of the heatmap represents a sample from an RNA-seq-based A. thaliana gene expression atlas [1]; all samples of the transcriptome map were used. For each row (representing genes) the maximum (Max), minimum (Min), and coefficient of variation (CV) of expression are indicated on the right.

