Figure 2.
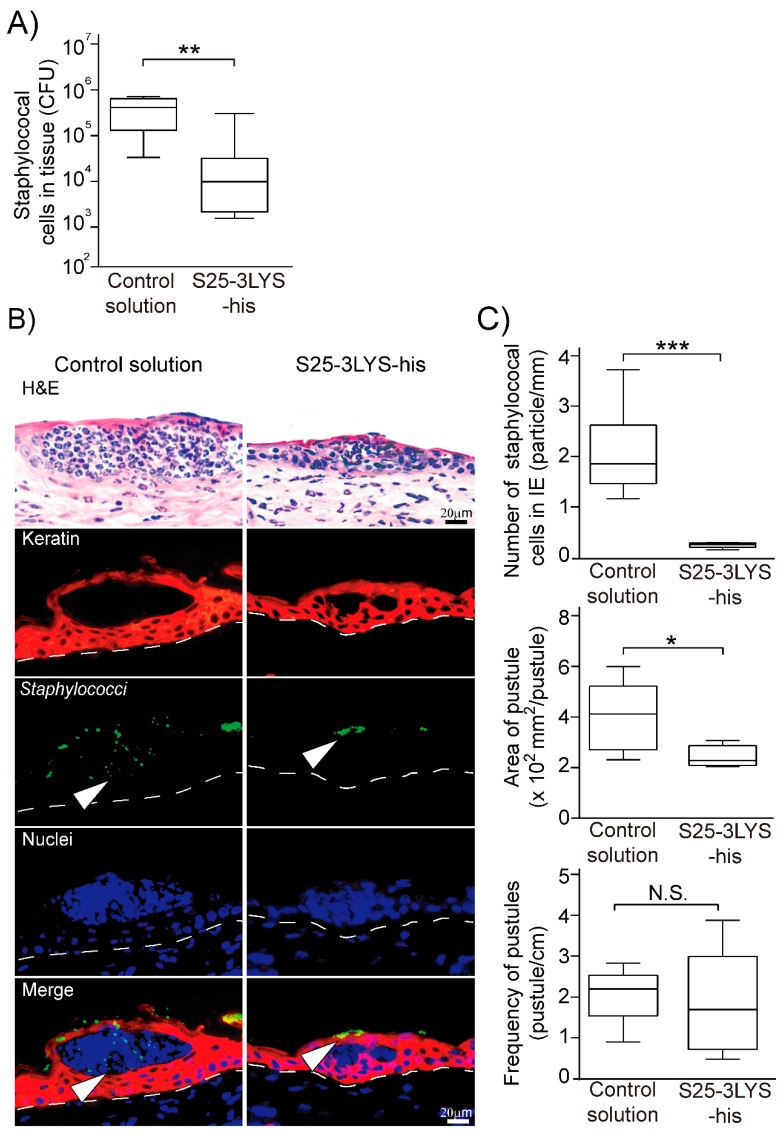
Evaluation of S25-3LYS-his treatment in an impetigo mouse model. (A) The density of staphylococcal cells in mouse skin. The densities of viable Staphylococcus spp. were measured using mannitol salt agar. The statistical significance is indicated as “**” (P < 0.01). Of note, when the total bacteria in the mouse skin was measured using tryptic soy agar, there was no statistical difference between the S25-3LYS-his-treated and control groups (P > 0.05; see Figure S4 in the supplemental material). (B) Pathological analysis of mouse skin tissues in the control solution (left) and S25-3LYS-his-treated solution (right). Representative photographs are shown. In the top micrographs, the tissues stained with hematoxylin and eosin (H&E) are shown. In the second from the top to the bottom micrographs, keratin, staphylococci, and nuclei-specific staining are shown in red, green, and blue, respectively. Staphylococci are indicated by white arrowheads (i.e., images on the third and the fifth rows from the top). The dotted lines indicate the basement membranes. (C) Staphylococcal cells in the intra-epidermal (IE) region, the area of pustules, and the frequency of pustules were measured by pathological analysis. Statistical significance is shown on the graph (*, P < 0.05; ***, P < 0.005); no statistical significance is indicated as “N.S.”

