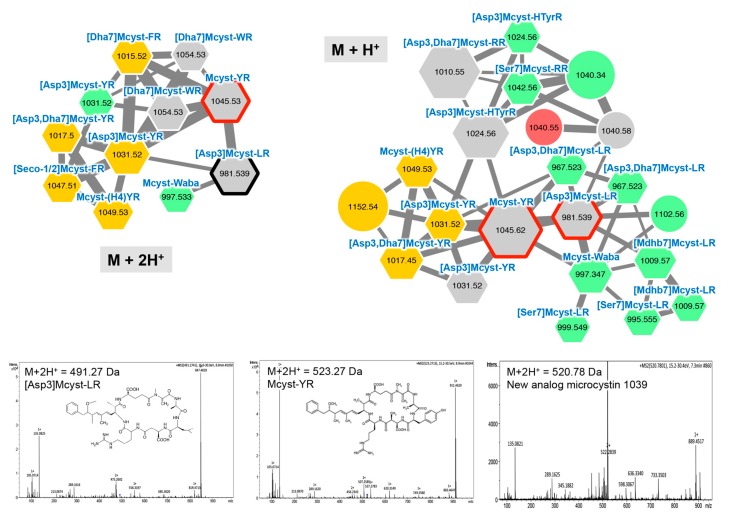
Figure 2.
Two main microcystin clusters highlighted by the GNPS analysis based on the MS/MS CID (collision ion dissociation) fragmentation spectra obtained from the Planktothrix strains. Analytes whose individual masses match with known microcystins are indicated by hexagons. Correspondences with standard microcystins similarly analyzed or with components, whose fragmentation patterns are available in library of the GNPS server, are indicated by heavy red and black lines, respectively. The color code is similar to the one in the Figure 1 caption. Examples of MS/MS spectra and chemical structures are shown for [Asp3] Mcyst-LR, Mcyst-YR, and a potential new microcystin variant exhibiting a m/z of 1040.58 Da. Note that (M + H)+ and (M + 2H)2+ ions are grouped in two distinct molecular clusters.

