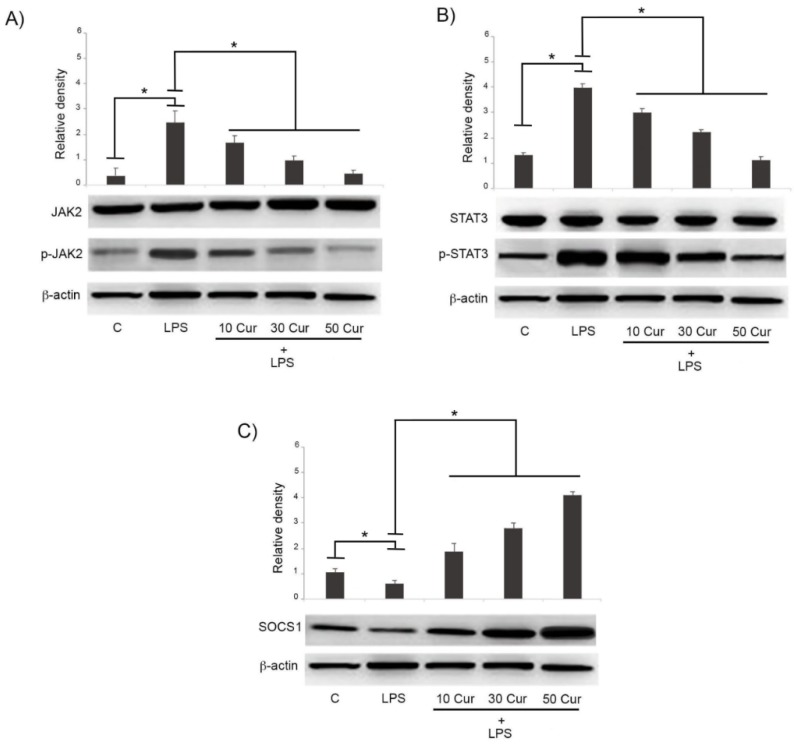
Figure 2.
Immunoblot analysis of (A) JAK2, (B) STAT3, and (C) SOCS-1 expression. BV-2 microglial cells were treated for 24 h with 1 μg/mL LPS alone or in the presence of various concentrations (10, 30, 50 μM) of curcumin (Cur). Untreated cells were used as controls (C). Bar graphs represent phospho/total JAK2 (A), phospho/total STAT3 (B) and SOCS-1 (C). Protein expression levels were normalized to β-actin, and results of densitometric analysis are expressed as means ± SD of five independent experiments. * p < 0.05.

