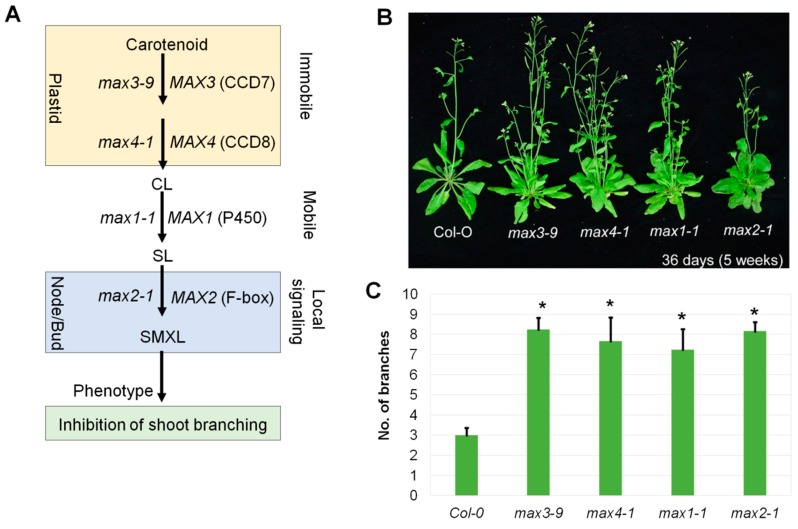
Figure 1.
Strigolactone biosynthesis pathway and perception. (A) Strigolactone biosynthesis, signaling perception pathway and mutants identified by genetic methods in this pathway. (B) The max mutants with their branched phenotypes. (C) Number of branches per max mutant compared with the wild-type. Bars indicate standard error of five replicates. The asterisk sign (∗) indicates the significant difference between max mutants and Col-0 at p < 0.05 (Student’s t-test).

