Figure 2.
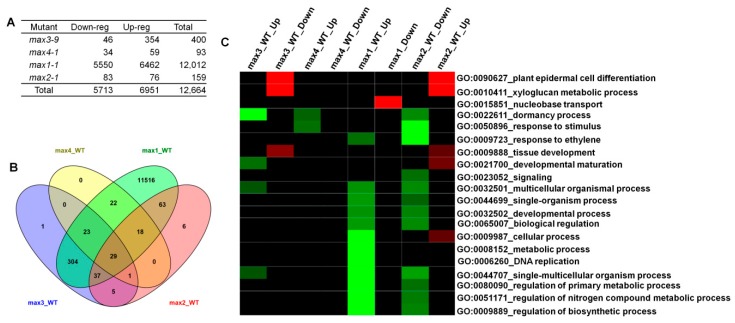
Microarray analysis of the gene expression profiles in max mutants compared with wild-type. (A) Significantly changed genes in max mutants compared with wild-type. (B) Venn diagram for several genes that changed expressed levels in mutants compared with those of wild-type control. (C) Heatmap of differentially expressed Gene Ontology (GO) in all four max mutants. Panel on the right side of the heat map shows the GO identity and its role in various biological processes. Red boxes in the heat map show up-regulated GO, green boxes show down-regulated GO, and black boxes show unchanged GO expression in four max mutants.

