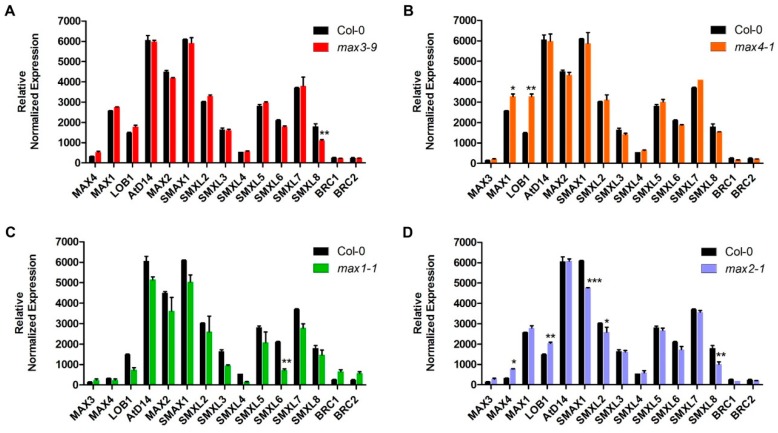
Figure 3.
The transcript level of genes involved in strigolactone biosynthesis and signaling pathway in four max mutants. (A–D) Relative expression of SL metabolism-related genes in max3-9, max4-1, max1-1, and max2-1 mutant respectively compared with wild-type based on microarray results. Leaf of the mature plant was used to isolate RNA. Each data point represents the mean (±SE) from 2 different plants. The star indicates a significant difference between mutant and wild-type. * p < 0.05, ** p < 0.05, *** p < 0.001 (Two-way ANOVA test).

