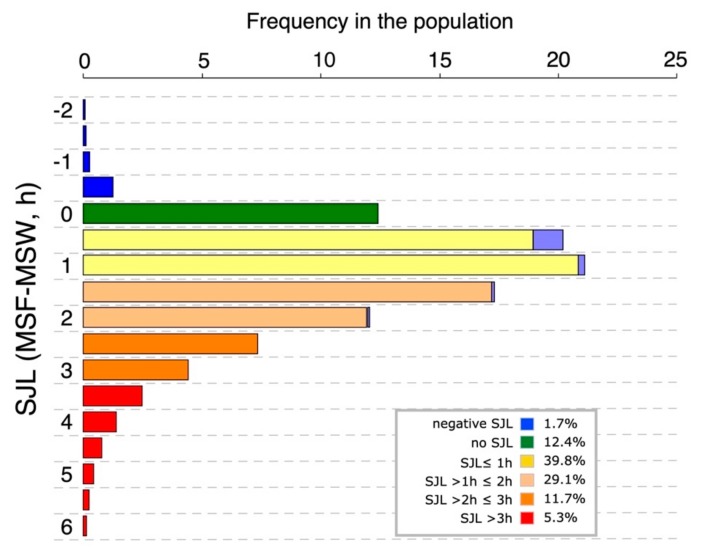
Figure 4.
Distributions of social jetlag (SJL) in the Munich ChronoType Questionnaire (MCTQ) database (as of July 2017). The distribution is based on half-hourly bins (population as described in Figure 1 for midsleep on free days sleep corrected (MSFsc)). Color-coding is arbitrary and classifies the population into the six SJL groups indicated in the legends. To signify the distribution of the absolute version of SJL (see text for details), the negative SJL categories are mirrored as light blue extensions of the respective positive SJL categories.

