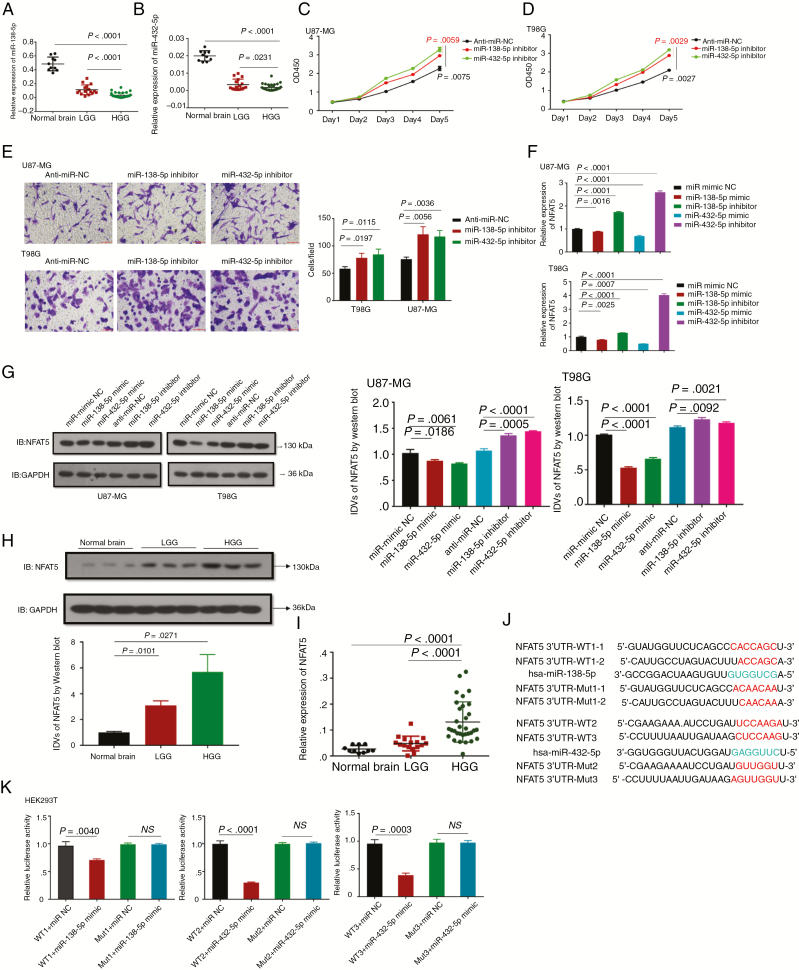
Fig. 4.
MiR-138-5p/miR-432-5p suppress cell proliferation and invasion by targeting NFAT5 in GBM cells. (A, B) The relative expression levels of miR-138-5p (A) and miR-432-5p (B) were determined by qRT-PCR in 48 gliomas (WHO grade II: n = 16, WHO grade III: n = 10, WHO grade IV: n = 22) and 10 normal controls. (C, D) CCK-8 assays of U87-MG and T98G transfected with anti-miR NC, miR-138-5p or miR-432-5p inhibitor were performed. At the indicated time points, the number of cells per well was measured according to the absorbance (450 nm). (E) Transwell analysis of U87-MG and T98G transfected with anti-miR NC, miR-138-5p or miR-432-5p inhibitor was performed. Representative images are presented (magnification: 200×; scale bar = 100 μm). (F, G) The relative NFAT5 mRNA and protein expression levels in U87-MG and T98G transfected with different vectors were analyzed by qRT-PCR (F) and western blotting (G). (H) Western blot analysis of NFAT5 was performed in fresh glioma tissues (LGG: n = 12; HGG: n = 12) and normal controls (n = 5). Images of representative expression patterns are presented. (I) The relative NFAT5 expression level was analyzed by qRT-PCR in 48 gliomas (WHO grade II: n = 16, WHO grade III: n = 10, WHO grade IV: n = 22) and 10 normal controls. (J) A schematic drawing shows the putative miR-138-5p/miR-432-5p binding sites with respect to NFAT5. (K) Luciferase activity assays were performed in wild-type and mutant HEK293T cells transfected with different vectors. A multiple comparisons test adjusted P-value of <0.05 was considered statistically significant. Error bars represent the mean ± SD.

