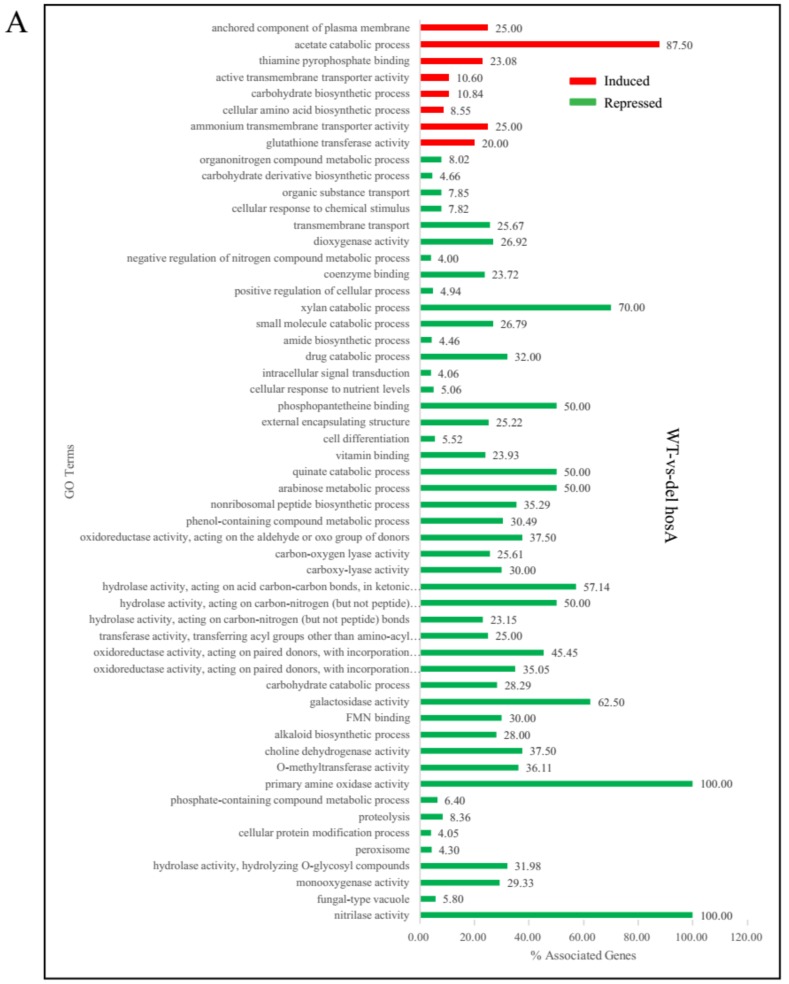
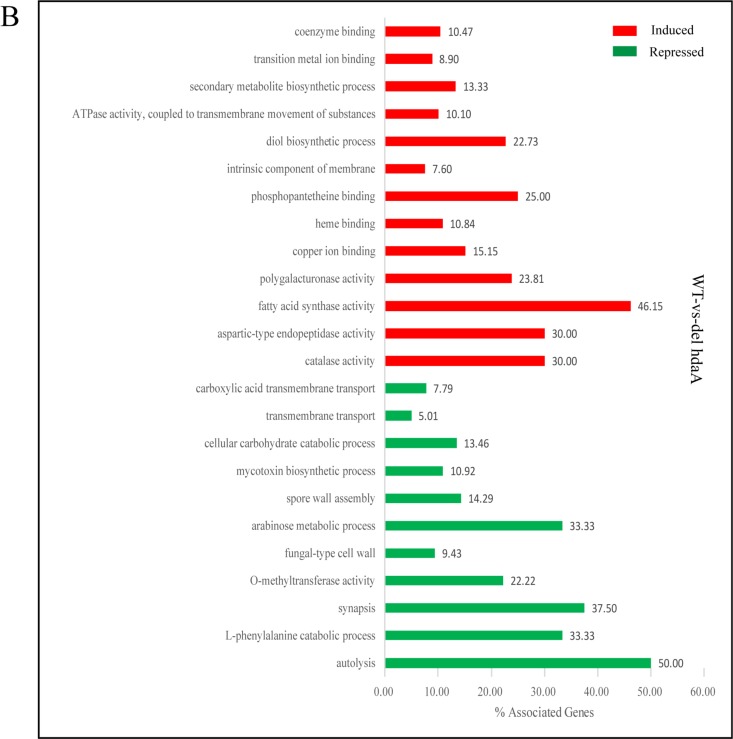
Figure 4.
GO enrichment analysis of differentially induced or repressed genes in the ΔhosA and ΔhdaA mutants. (A) Representation of the main significantly induced and repressed pathways (p < 0.001) in the ΔhosA mutant strain compared with the wild-type strains. (B) Representation of the main significantly induced and repressed pathways (p < 0.001) in the ΔhdaA mutant strain compared with the wild-type strains.


