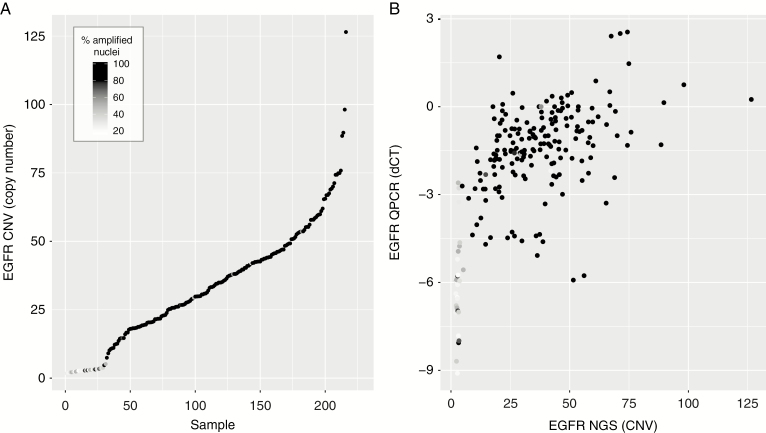
Fig. 5.
Comparison between EGFR amplification as determined by NGS with FISH and RT-qPCR. (A) Ranked copy number estimates by NGS show that samples with low copy numbers also had relatively few EGFR-amplified nuclei (darker points). Note the steep increase from <5 copy numbers to >10 copy numbers. (B) Copy number estimates by NGS correlate with gene expression derived from RT-qPCR. Samples with low copy numbers often had low levels of EGFR expression.

