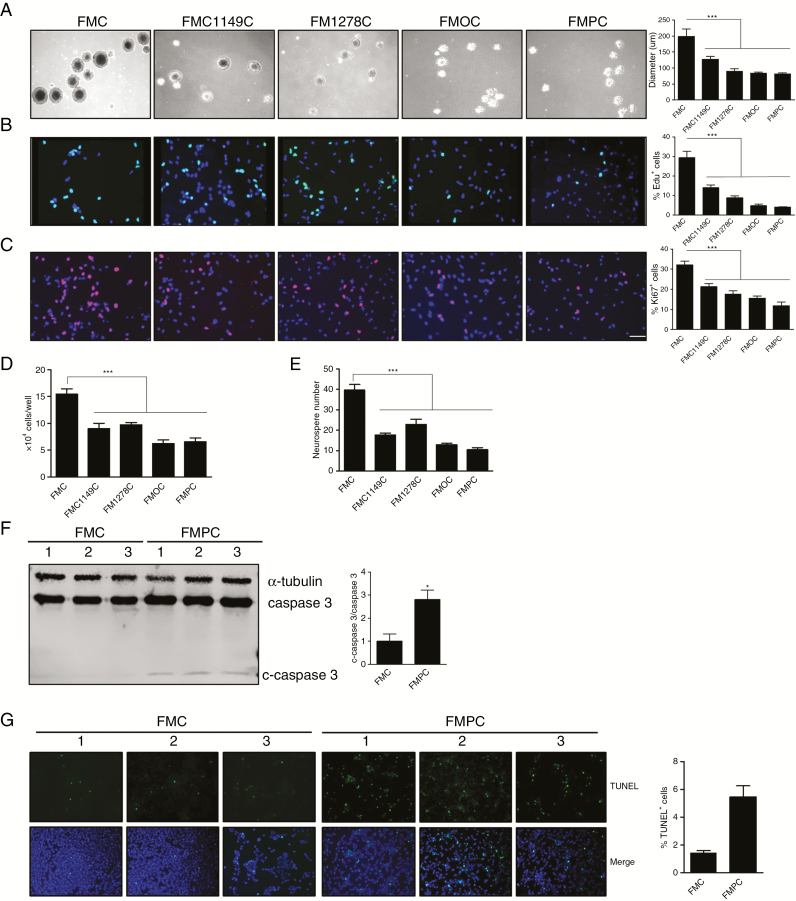
Fig. 2.
Optic GSCs exhibit different levels of proliferation, self-renewal, and apoptosis. Optic GSC neurosphere diameters (A), %EdU+ cells (B), %Ki67+ cells (C), and direct cell counting (D) demonstrate that FMC o-GSCs exhibit the highest level of proliferation, as well as the highest levels of self-renewal. (E, F) Immunoblotting revealed more cleaved caspase-3 in FMPC o-GSCs after 48 hours starvation relative to FMC o-GSCs. (G) TUNEL assay revealed that FMPC o-GSCs have a higher percentage of TUNEL+ cells relative to FMC o-GSCs after 48 hours starvation. Data are presented as mean ± SEM. *P < 0.05, ∗∗∗P < 0.001. Scale bar: 40 μm.

