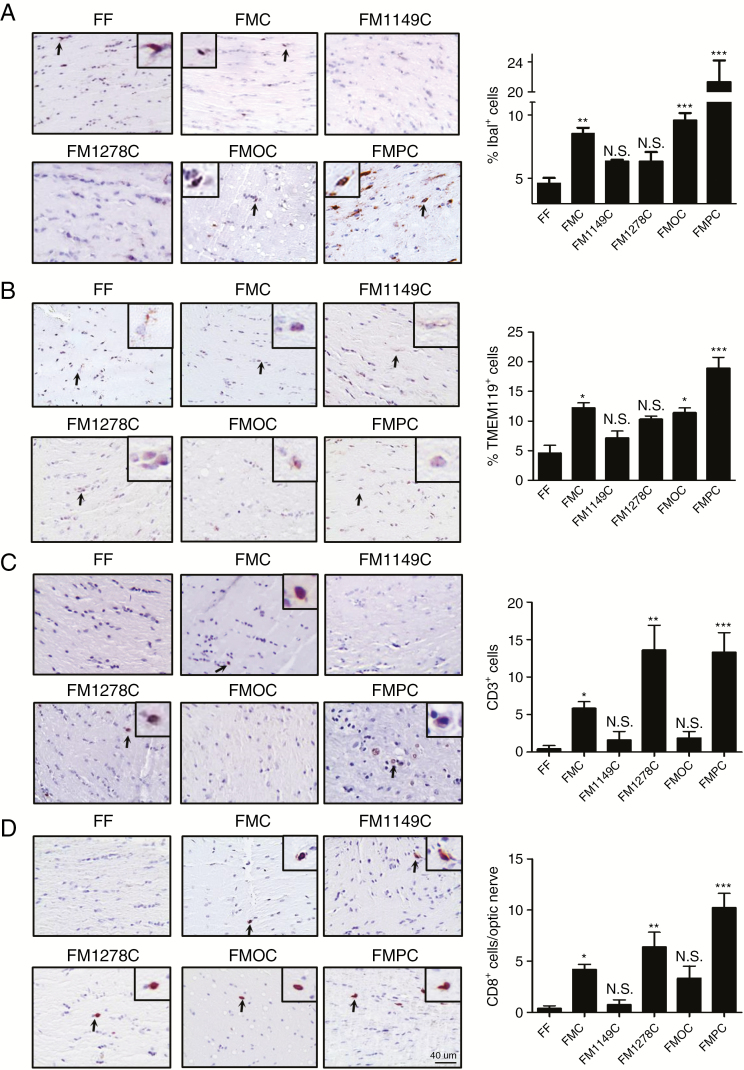
Fig. 3.
Differential infiltration of microglia and T cells in the Nf1 optic glioma strains. (A, B) FMC, FMOC, and FMPC mice exhibit more Iba1+ and Tmem119+ cells (microglia; %Iba1+ or %Tmem119+ cells) relative to FF mice, where FMPC optic gliomas have the highest levels of microglia infiltration. (C) FMC, FM1278C, and FMPC mouse optic gliomas have greater CD3+ T cell infiltration relative to FF mice, where FM1278C and FMPC murine optic gliomas have the highest level of T cell infiltration. (D) The majority of the CD3+ cells are CD8+ T cells. Data are presented as mean ± SEM. *P < 0.05, **P < 0.01, ***P < 0.001. Scale bar: 40 µm.

