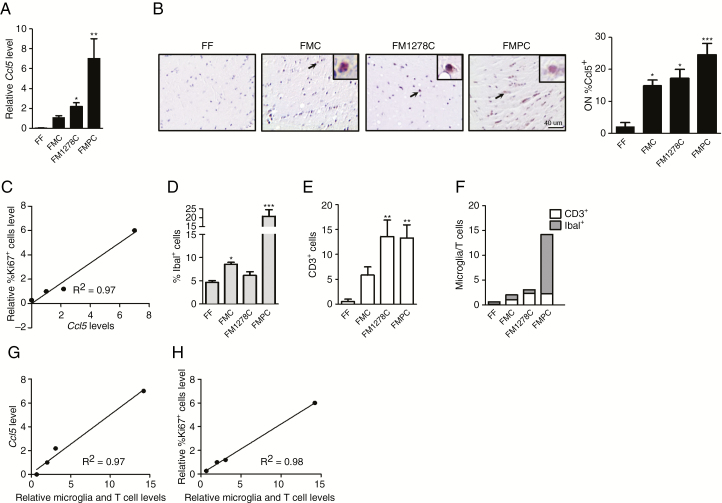
Fig. 4.
Microglia and T cell content correlates with Ccl5 levels and Nf1 optic glioma proliferation. (A) Quantitative RT-PCR revealed increased optic glioma Ccl5 gene expression in FMPC (7-fold) and FM1278C (2.1-fold) mice relative to FMC mice. No Ccl5 expression was detected in FF optic nerves. (B) FMC, FM1278C, and FMPC mice exhibited a greater percentage of Ccl5+ cells relative to FF mice by immunohistochemistry. Scale bar: 40 μm. (C) Optic nerve Ccl5 expression correlates (R2 = 0.97) with relative tumor proliferation (relative %Ki67+ cells). Graphs demonstrating the %Iba1+ cells (D), number of CD3+ cells (E), and the sums of the relative increases of microglia and T cells in the FMC, FM1278C, and FMPC optic gliomas relative to normal (FF) optic nerve (F). The sum of the relative increases of microglia and T cells combined correlates (R2 = 0.97) with optic nerve (G) Ccl5 expression and (H) proliferation (relative %Ki67+ cells). Data are presented as mean ± SEM. *P < 0.05, **P < 0.01.

