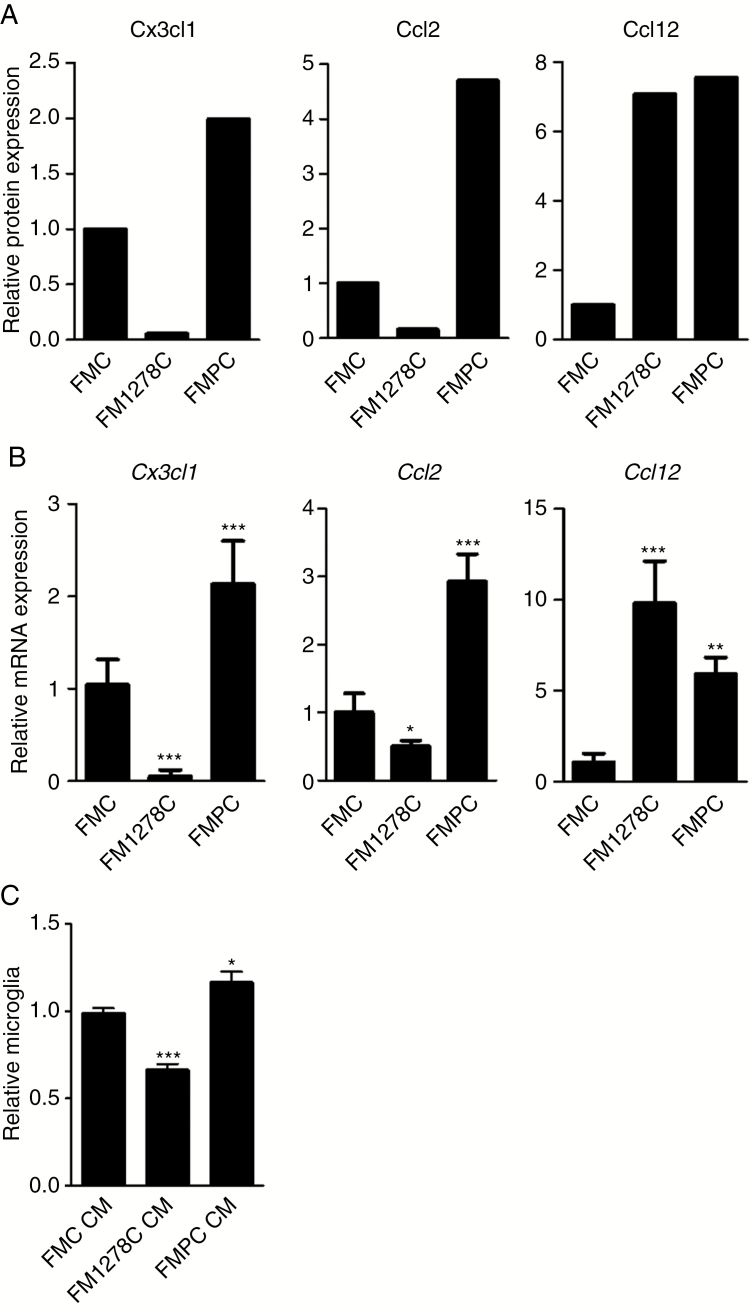
Fig. 5.
Differential o-GSC chemokine production dictates microglia and T cell infiltration. (A) FMC and FMPC o-GSC CM have the highest levels of Cx3cl1 expression, FMPC the highest level of Ccl2 expression, and FM1278C and FMPC the highest level of Ccl12 expression. (B) Differential Cx3cl1, Ccl2, and Ccl12 RNA expression was confirmed by qRT-PCR. (C) Greater microglia migration was observed with FMPC o-GSC CM relative to FMC or FM1278C o-GSC CM. Data are presented as mean ± SEM. *P < 0.05, **P < 0.01, ***P < 0.001.

