
Figure 3. Analysis of the PEG depletion method in an independent sample set.
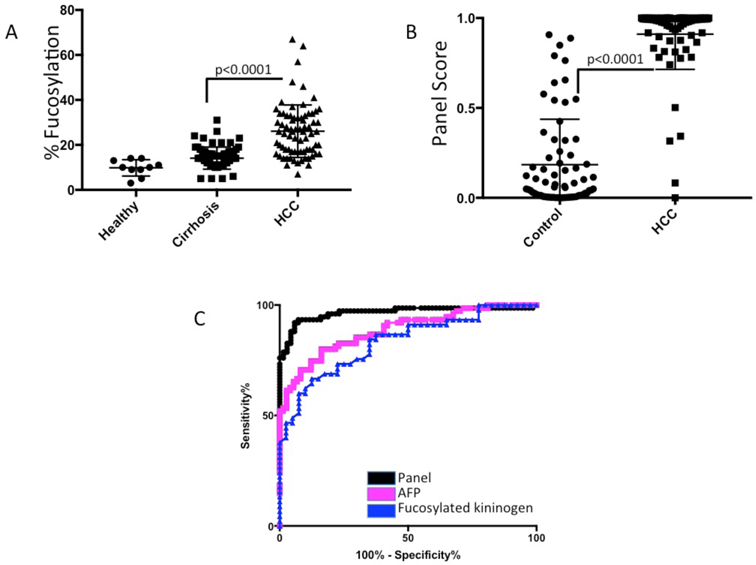
A) Scatter plot of kininogen lectin ELISA following PEG-8000 depletion in 10 healthy patients, 75 patients with HCC and 75 patients with HBV associated chronic liver disease (detailed in Table 1). B) Scatter plot of the kininogen panel scores in 75 patients with HCC and 75 patients with liver cirrhosis C) ROC curves for fucosylated kininogen, AFP or the kininogen panel.