Fig. 7.
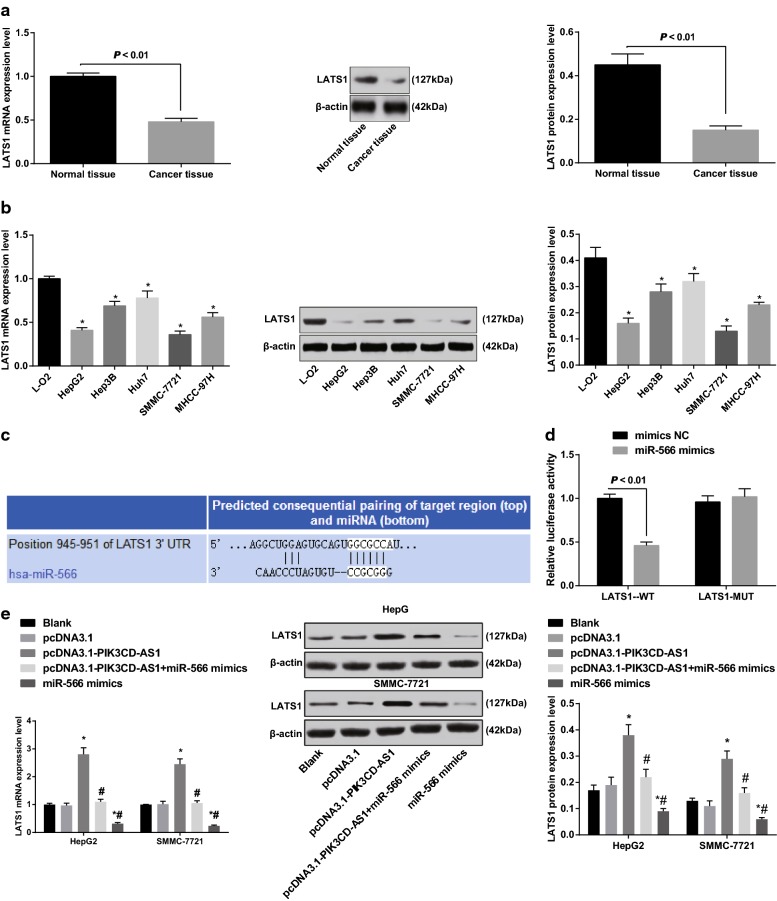
Expression of LATS1 in HCC tissues and cells and verification of the targeting relationship between miR-566 and LATS1. a Detection of mRNA and protein expression of LATS1 in HCC and adjacent normal tissues by RT-qPCR and western blot analysis, n = 68; b RT-qPCR and western blot analysis were used to detect the expression of LATS1 in HCC cells and normal liver cells; c prediction of targeting relationship between miR-566 and LATS1 by bioinformatics software; d luciferase activity assay to verify the targeting relationship between miR-566 and LATS1; e RT-qPCR and western blot analysis were used to detect the expression of LATS1 in HCC cells of each group; the experiment was repeated three times; the data was analyzed by the t test or one-way ANOVA, and after ANOVA, the pairwise comparison was analyzed by the LSD-t test; *P < 0.05 vs L-O2 cells or the blank group

