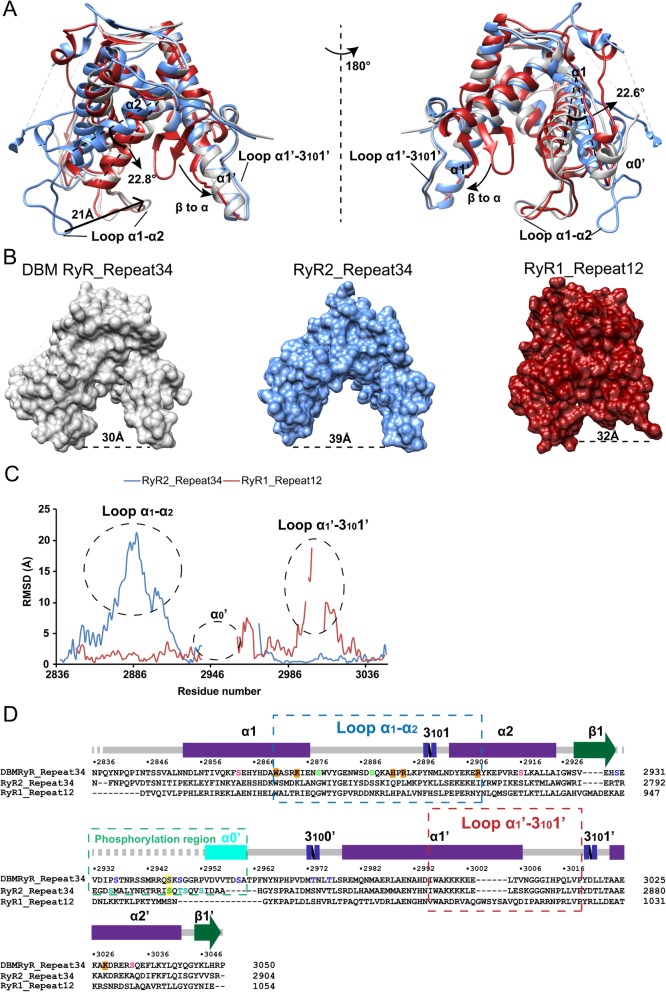
Fig. 3.
Comparison of repeat domains. a Superpositions of the DBM RyR Repeat34 crystal structure (gray) with mouse RyR2 Repeat34 crystal structure (blue; PDB ID 4ETV) and rabbit RyR1 Repeat12 crystal structure (red; PDB ID 5C30). The main structural differences are labeled. b Comparison of the surface views of the three structures in panel A. The distance between the two ends of each horseshoe is labeled. c Plot showing per residue root mean square deviation (RMSD) for the mouse RyR2 Repeat34 and rabbit RyR1 Repeat12 crystal structures relative to DBM RyR Repeat34 crystal structure. d Sequence alignment of DBM Repeat34, mouse RyR2 Repeat34, and rabbit RyR1 Repeat12. Secondary structure elements for DBM RyR Repeat34 are indicated above the sequence. Phosphorylation sites in DBM are colored in blue, green, and pink depending on their location within the 3-dimensional structure of the domain (same color scheme as in Fig. 6). Phosphorylation sites in RyR2 are colored in turquoise. The classic PKA site RyR2 S2808 and the equivalent PKA site DBM RyR S2946 are highlighted in yellow. Residues contributing to the glycerol binding are highlighted in orange

