Fig. 5.
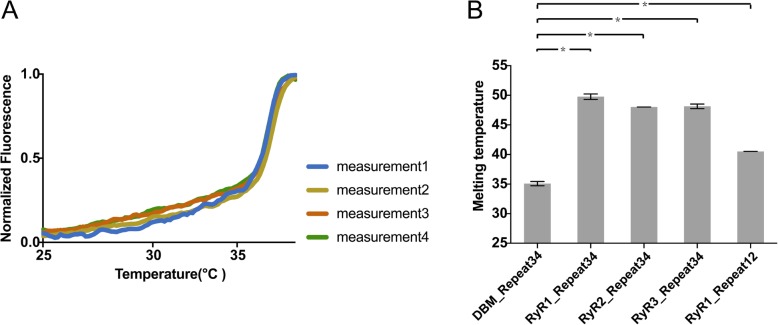
Thermal melt analysis. a Four measurements of thermal melt curves for DBM RyR Repeat34. b Comparison of the melting temperatures for Repeat34 from DBM RyR, rabbit RyR1, mouse RyR2, human RyR3, and Repeat12 from rabbit RyR1. Error bars show the standard deviation. *P < 0.0001 (two-tail Student T test)

