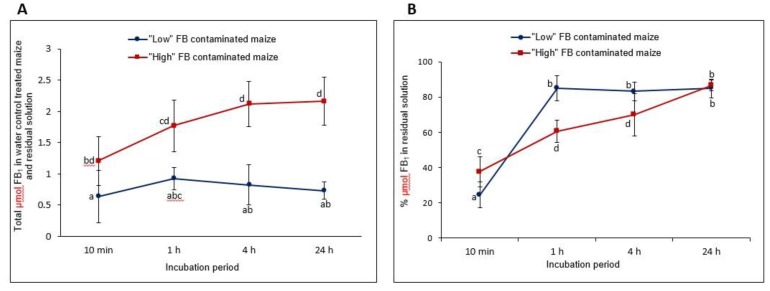
Figure 3.
Total amount of FB1 leaching into the incubation mixture in the absence of the enzyme as a function of time, of “low” and “high” FB contaminated maize (A). The % µmol FB1 leaching into the residual water during a comparable time of incubation (B). Values represent means ± standard deviations of three to five replications of experiments. Statistical analyses are based on natural log (ln) and differences (p < 0.05) between treatment periods within and between “low” and “high” FB contaminated maize are indicated with different letters.

