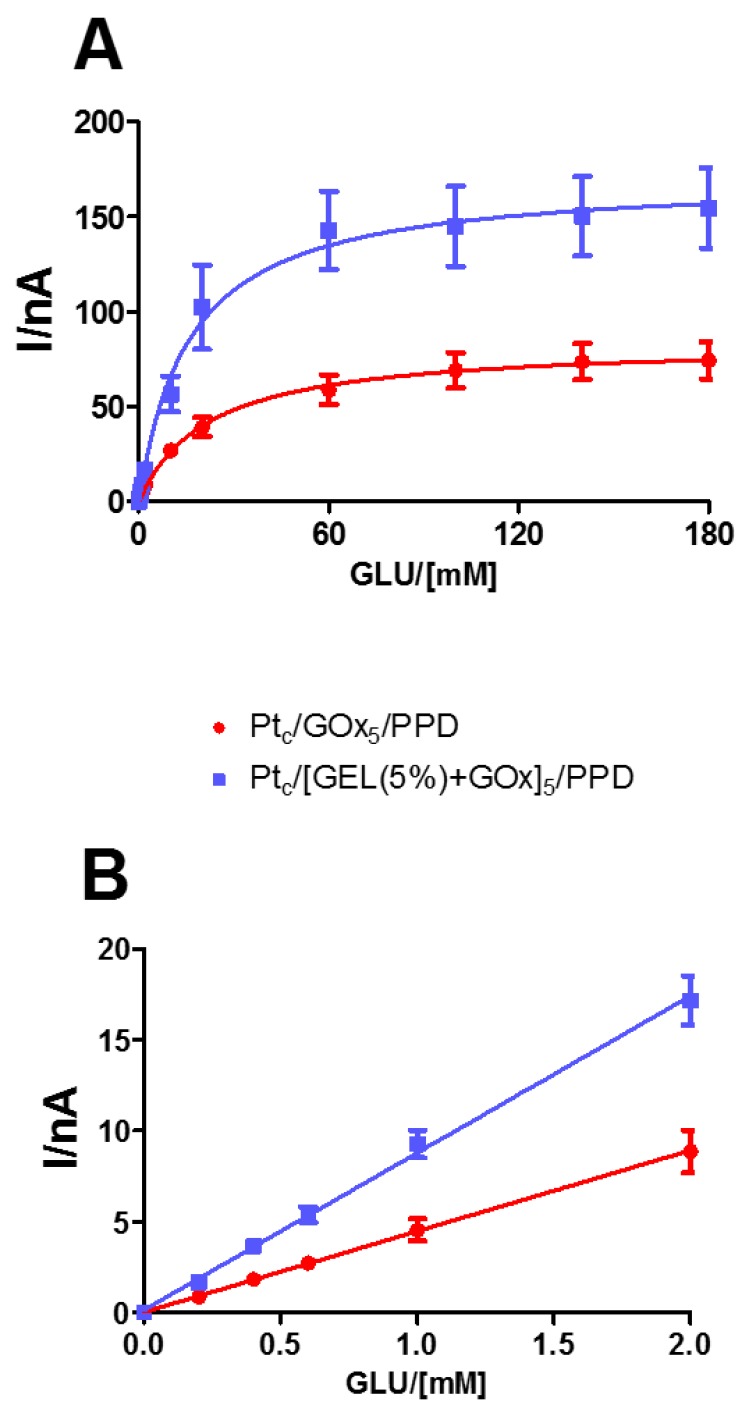
Figure 3.
(A) Michaelis−Menten kinetics with a range of 0–180 mM and relative 0–2.0 mM linear regression; (B) plots of different glucose biosensor designs (n = 4) loading GOx alone (red line: Ptc/GOx5/PPD) or mixed with starch-based hydrogel (5%) (blue line: Ptc/[GEL (5%) + GOx]5/PPD). Values are expressed as mean ± SEM. * p < 0.05 vs. red line.

