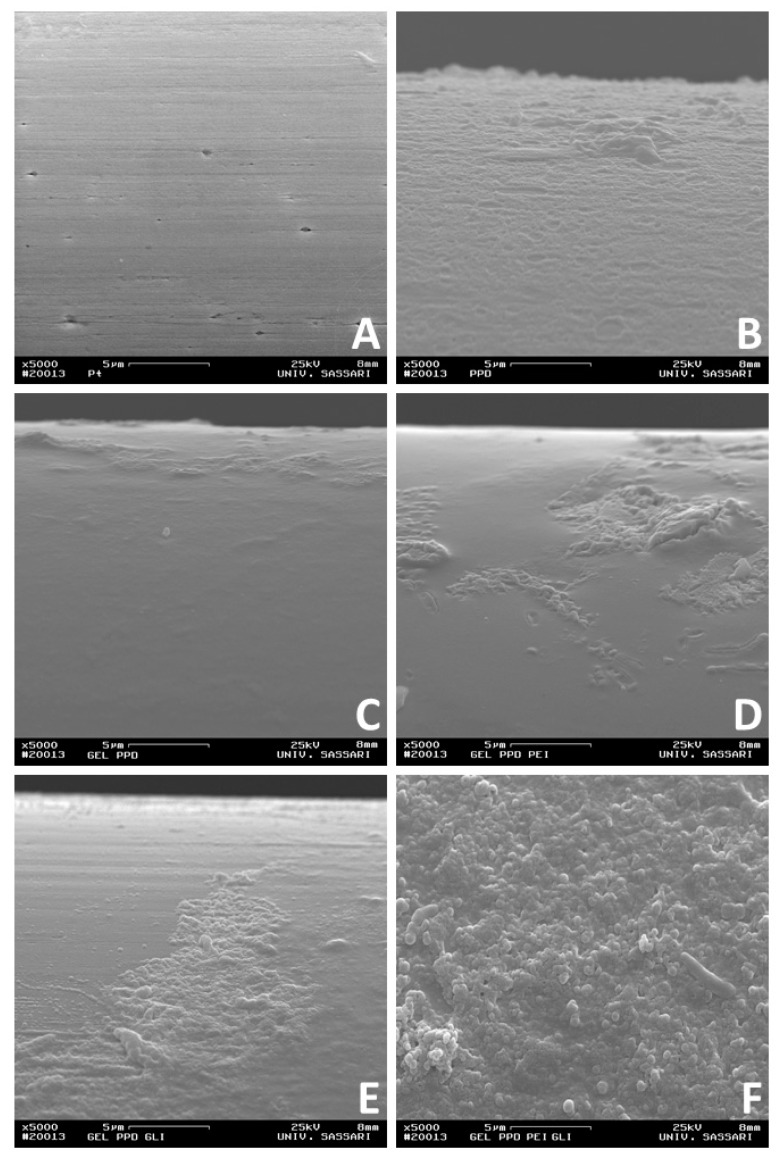
Figure 4.
Scanning electron microscope (SEM) of different sensor configurations at 5000X magnification. Ptc (Panel A); Ptc/PPD (Panel B); Ptc/GEL(5%)/PPD (Panel C); Ptc/[GEL (5%) + PEI (1%)]5/PPD (Panel D); Ptc/[GEL (5%) + GLY (1%)]5/PPD (Panel E); Ptc/GEL (5%) + GLY (1%) + PEI (1%)]5/PPD (Panel F).

