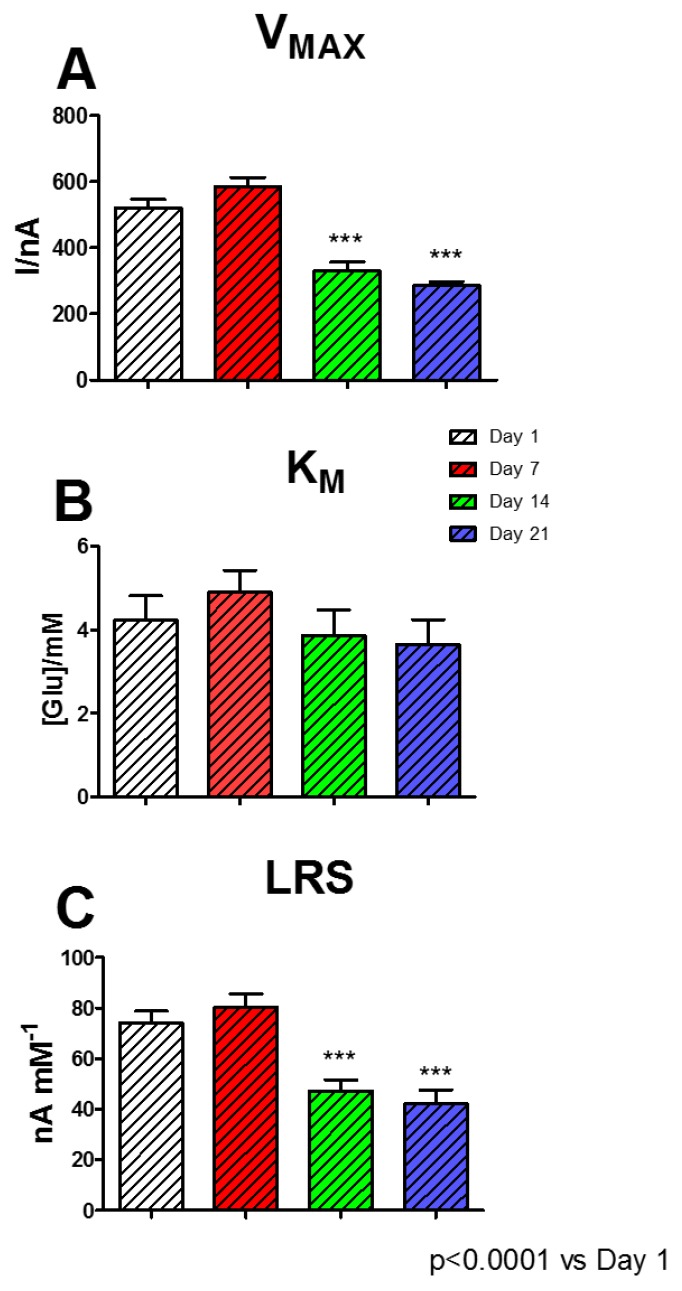
Figure 6.
Glucose biosensor stability over time. Bar chart displaying the changes of VMAX (Panel A), KM (Panel B), and LRS (Panel C) on the highest performing biosensor design B4: Ptc/[GEL(5%) + PEI(1%) + GLY(1%) + GOx]5/PPD, in a period of 21 days. White bar: Day 1; red bar: Day 7; green bar: Day 14; blue bar: Day 21. Values are expressed as mean ± SEM. * p < 0.0001 vs. Day 1.

