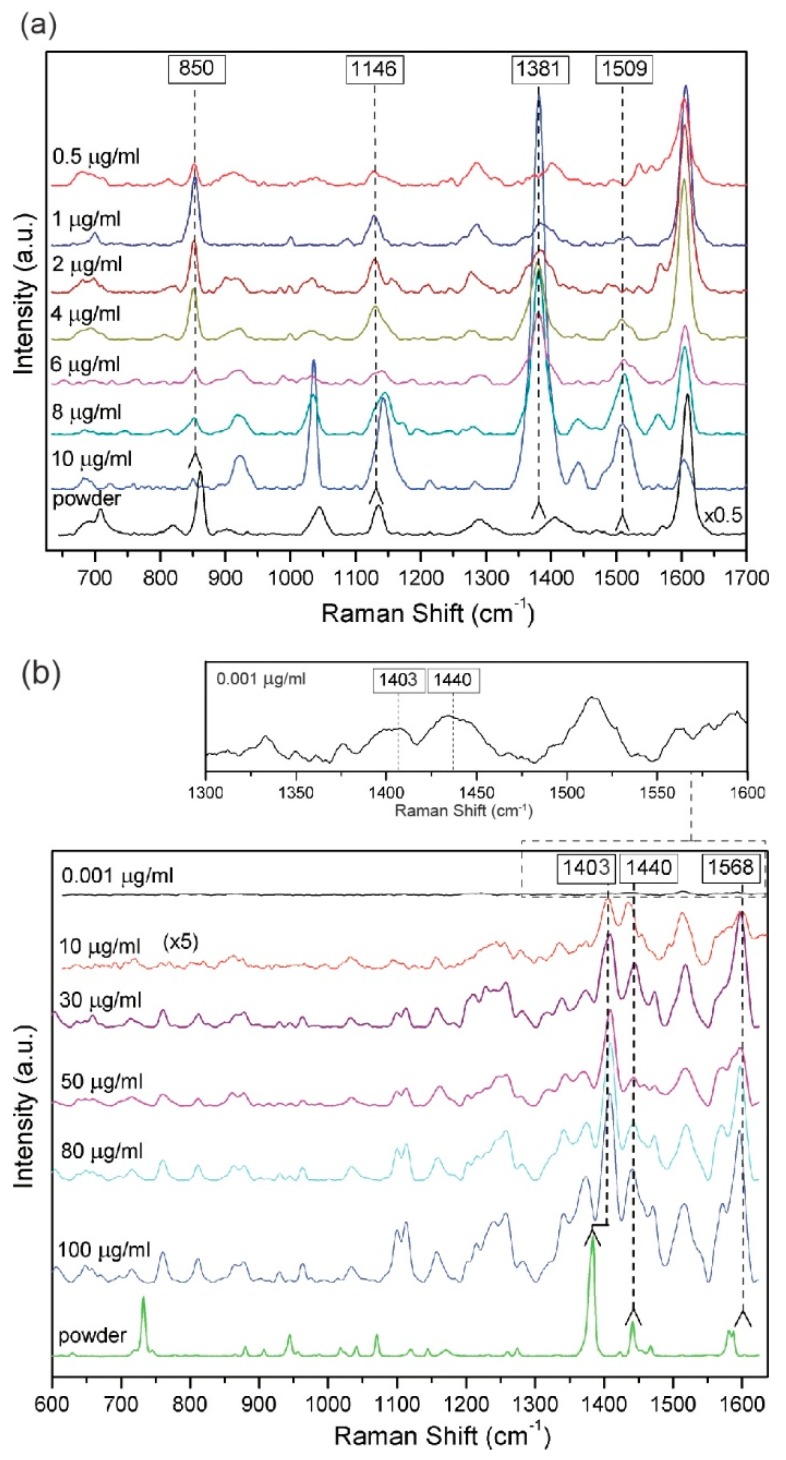
Figure 6.
The averaged selected SERS spectra of Thiram (a) and Carbaryl (b) pesticides, measured in five different places of PET/ITO/Ag platforms. The Raman spectra of pesticides powder are presented on the bottom of each figures. The main Raman bands are indicated by dashed lines. Three accumulation for four seconds of SERS spectra were recorded using a 785 nm laser excitation (the laser power was below 5 mW).

