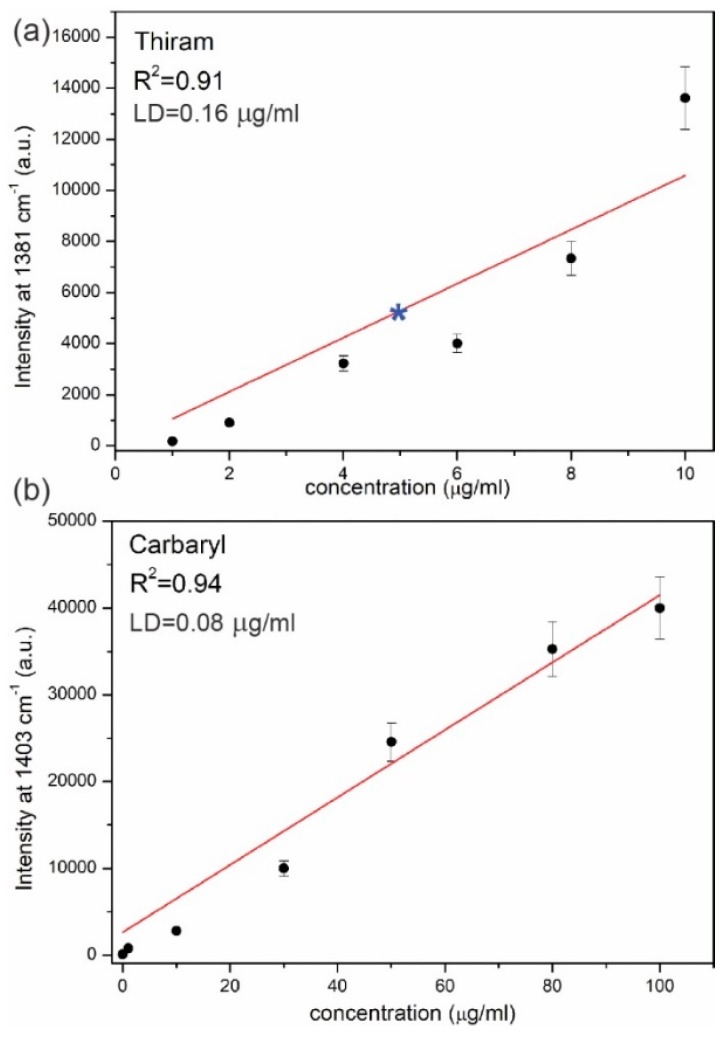
Figure 7.
Calibration curves for Thiram (a) and Carbaryl (b) pesticides. Each point is based on the average SERS spectra taken in five different places on the PET/ITO/Ag platform. The error bars indicates 9% deviation at a chosen band. Star corresponds to the intensity of the 1381 cm−1 band in the SERS spectrum of the apple juice with Thiram pesticide. The limit of detection (LD) for Thiram is 0.16 µg/mL, whereas for Carbaryl it is 0.08 µg/mL.

