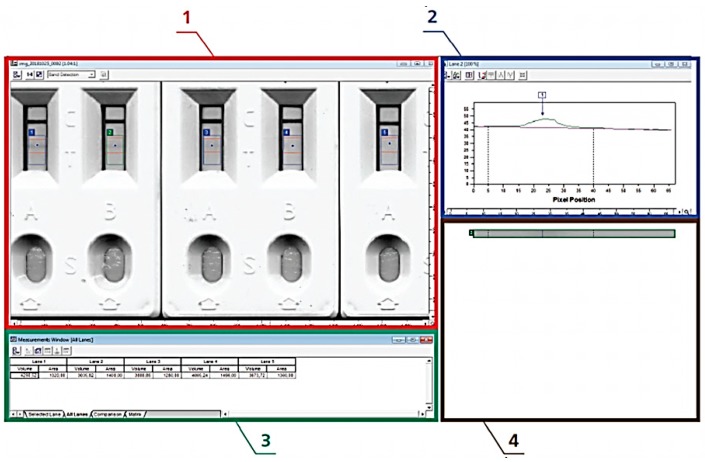
Figure 3.
Working window in the Total Lab Quant software and its use for the quantitative assessment of immunochromatography results. (1) Image of test strips array, (2) distribution of staining intensity along the analyzed test strip, (3) identification data of the bonding zone and assessment of its staining intensity, and (4) zoomed-in image of the analyzed test strip.

