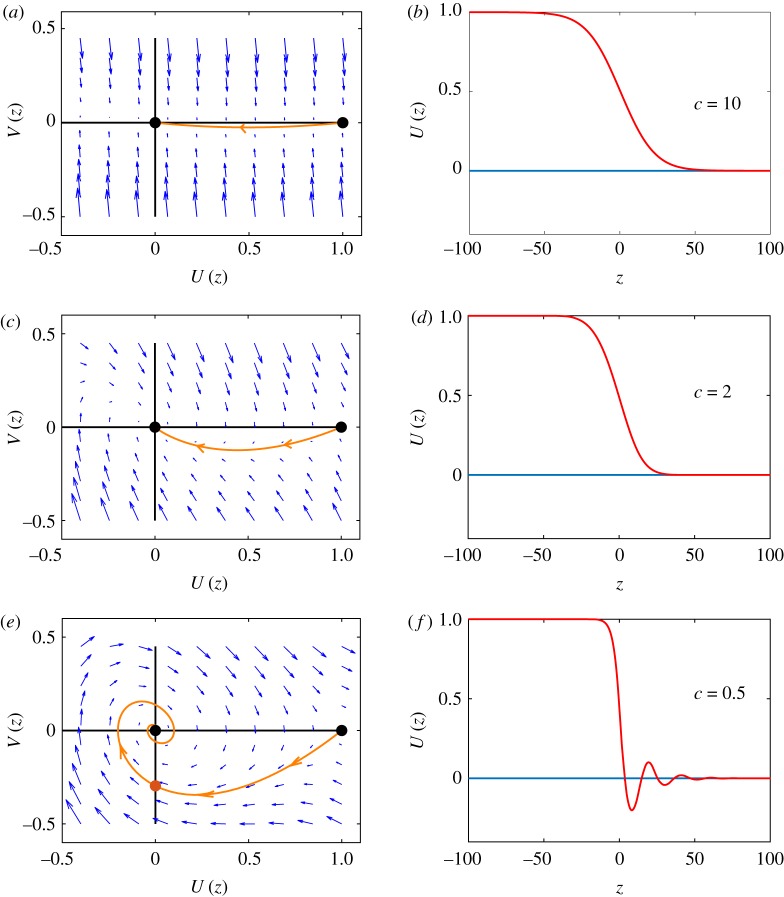
Figure 3.
Phase planes and density profiles for the Fisher–KPP equation with various choices of c. (a) Phase plane and heteroclinic trajectory for c = 10. (b) The corresponding density profile for the heteroclinic trajectory in (a). (c) Phase plane and heteroclinic trajectory for c = 2. (d) The corresponding density profile for the heteroclinic trajectory in (c). (e) Phase plane and heteroclinic trajectory for c = 0.5. (f ) The corresponding density profile for the heteroclinic trajectory in (e). Equilibrium points at (1, 0) and (0, 0) are shown with black discs. The blue arrows show the flow associated with the dynamical system, and the solid orange line shows the heteroclinic trajectory that runs between (0, 0) and (1, 0). The orange disc in (e) shows the location where the heteroclinic trajectory intersects with the U(z) = 0 axis where V (z) < 0. (Online version in colour.)

