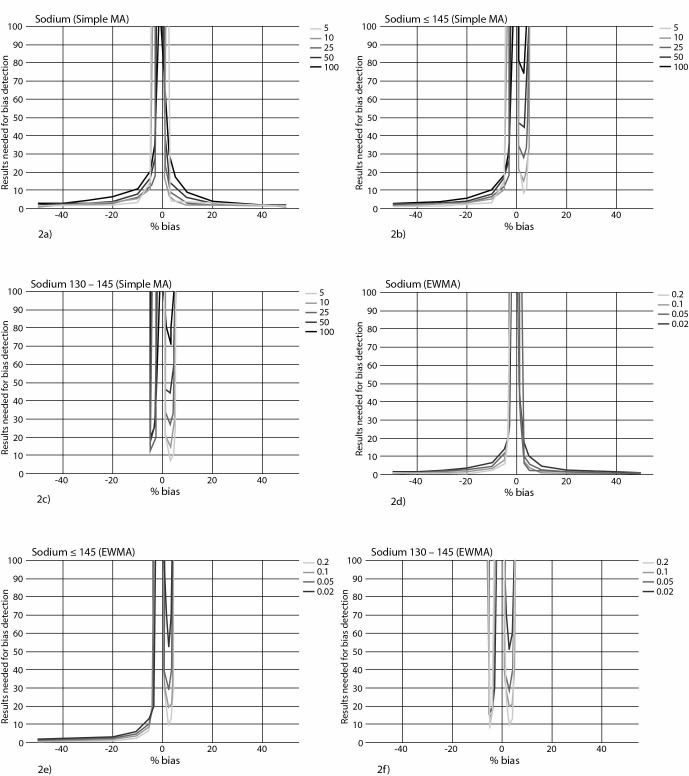
Figure 2.
Influence of truncation limits on moving average curves for sodium. 2a) Moving average (MA) curves for sodium at different sizes of the batches for simple MA, without truncation limits. 2b) Curves of the same MA procedures for sodium after the introduction of an upper truncation limit (≤ 145 mmol/L). 2c) Curves of the same MA procedures for sodium, with lower and upper truncation limits (130 mmol/L ≤ Na ≤ 145 mmol/L). 2d) MA curves for sodium at different weighting factors for EWMA, without truncation limits. 2e) Curves of the same EWMA procedures for sodium after the introduction of an upper truncation limit (≤ 145 mmol/L). 2f) Curves of the same EWMA procedures for sodium, with lower and upper truncation limits (130 mmol/L ≤ Na ≤ 145 mmol/L). EWMA - exponentially weighted moving average.

