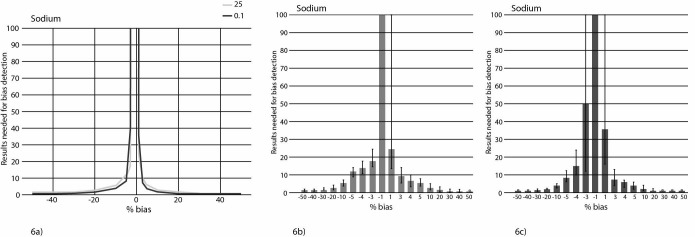
Figure 6.
6a) Candidate curves for the optimal moving average (MA) procedure for sodium: simple MA with a batch size of 25 and EWMA with a weighting factor 0.1. 6b) MA validation chart for simple MA for sodium with batch size 25. 6c) MA validation chart for the EWMA with a weighting factor 0.1. EWMA - exponentially weighted moving average.

