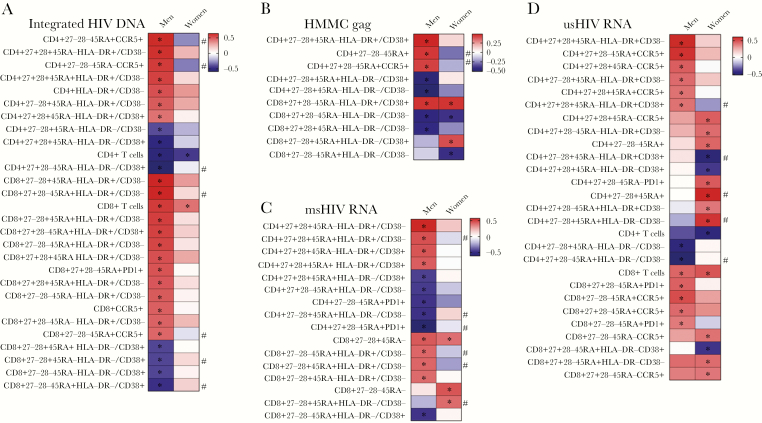
Figure 5.
Associations between T-cell parameters and virologic measures by sex. A, Correlation analysis for T-cell parameters and integrated human immunodeficiency virus (HIV) stratified by sex. Box color indicates the strength of the Spearman correlation based on ρ value (red indicates a strong positive correlation and blue indicates a strong inverse correlation). *P < .05. #Statistically significant difference in correlation values between men and women. Similar information is shown for Spearman correlation analysis for T-cell parameters and HMMC gag single-copy assay (B), for T-cell parameters and multiply spliced HIV RNA (C), and for T-cell parameters and unspliced HIV RNA (D). Abbreviations: HMMC, xxx; msHIV, multiply spliced human immunodeficiency virus; usHIV, unspliced human immunodeficiency virus.

